Technicals

Add as a preferred source on Google

FxWirePro: NZD/USD breaks 100-DMA resistance at 0.7202, bias higher, stay long

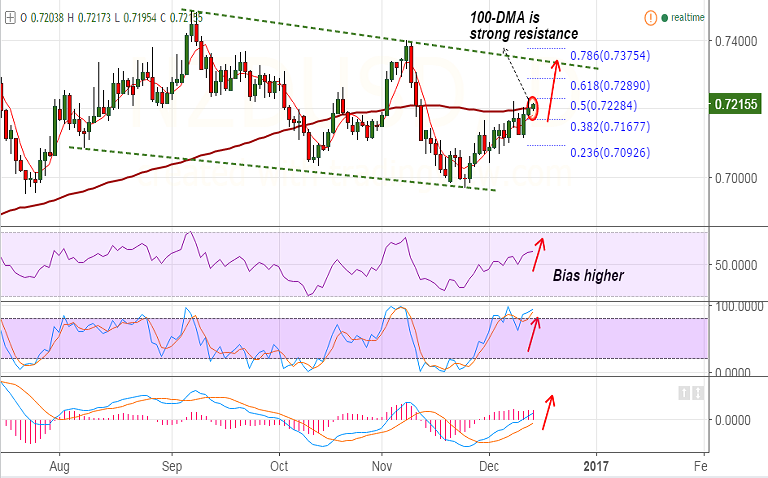
NZD/USD is testing 100-DMA resistance, break above will see further upside. Technical studies on daily and weekly charts are bullish. Bullish RSI divergence seen on daily charts. RSI is also strong at 58 levels with room…

1 min read
FxWirePro: NZD/USD breaks 100-DMA resistance at 0.7202, bias higher, stay long
Image from the original EconoTimes article

Read the original article

  • NZD/USD is testing 100-DMA resistance, break above will see further upside.
     
  • Technical studies on daily and weekly charts are bullish.
     
  • Bullish RSI divergence seen on daily charts. RSI is also strong at 58 levels with room to run.
     
  • The pair finds next major resistance at 0.7228 (50% Fib) and major support at 0.7102 (20-DMA).
     
  • Fed funds rate hike to a 0.50%-0.75% range is widely priced in by markets, Yellen’s press conference will be watched for any surprises.
     
  • Support levels - 0.7202 (100-DMA), 0.7180 (5-DMA), 0.7167 (38.2% Fib)
     
  • Resistance levels - 0.7228 (50% Fib), 0.7232 (Dec 13 high), 0.7265 (Oct 20 high), 0.7289 (61.8% Fib)
     

Recommendation: Good to long on decisive breakout above 100-DMA at 0.7202, target 0.7290/ 0.73
​

FxWirePro's Hourly NZD Spot Index was at 82.7856 (Slightly bullish), while Hourly USD Spot Index was at -77.9724 (Neutral) at 0515 GMT. For more details on FxWirePro's Currency Strength Index, visit http://www.fxwirepro.com/currencyindex.
 

Related articles

View all
Technicals

Major Pair Currency Score: AUDUSD Bearish

EURUSD - Levels to watch - 1.100 GBPUSD Levels to watch - 1.3180 USDCHF Levels to watch - 0.8400 USDCAD - Levels to watch - 1.4300 AUDUSD - Levels to watch - 0.7000 NZDUSD - Levels to watch - 0.5560