


 FxWirePro: GBP/NZD maintains bersish bias with focus on 2.2900 level
  FxWirePro: GBP/USD edges higher as traders await BoE guidance and UK fiscal clarity
  Major Forex Pairs Action Bias: GBPUSD and AUDUSD Turn Extremely Bearish
  FxWirePro: EUR/NZD up trend gains momentum but hurdles ahead
  AUDJPY Weakness Deepens: Sell Rallies Toward 112 as Aussie Dollar Falters
  Major Pairs Action Bias: USDCAD and USDCHF Stand Out as Extremely Bullish While GBPUSD and NZDUSD Turn Extremely Bearish
  FxWirePro: USD/CAD runs out of steam but maintains bullish outlook
  FxWirePro- Woodies pivot (Major)
  EUR/USD Bounces from Monthly Low, But Bearish Pressure Remains
  FxWirePro: EUR/ AUD gains some ground , but remains on bearish path
  FxWirePro: AUD/USD falls after softer-than-expected Australian Q2 CPI
  NZDJPY Pullback: Sell Rallies Toward 93.30 as Yen Weakness Eases
  FxWirePro: GBP/NZD gains some ground but bias is still bearish
  FxWirePro: GBP/AUD gains some upside momentum but still bearish
  JPY Action Bias: USDJPY Emerges as the Clear Bullish Pair to Watch Amid Mixed Crosses
  FxWirePro- Major Pair levels and bias summary


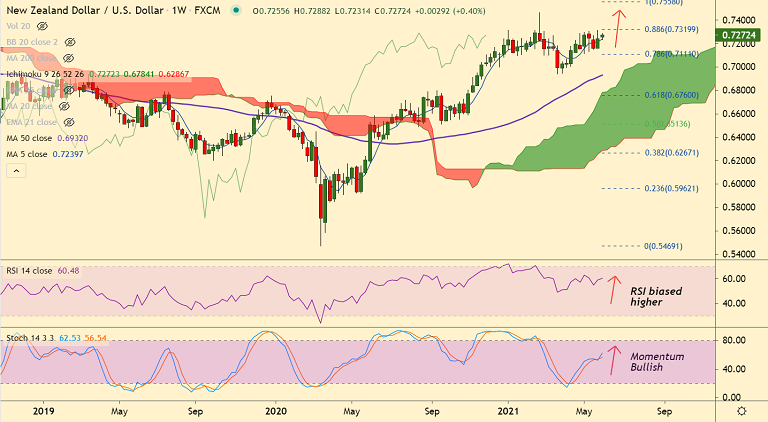
NZD/USD chart - Trading View
Spot Analysis:
NZD/USD was trading 0.08% higher on the day at 0.7275 at around 04:50 GMT
Previous Session's High/ Low: 0.7283/ 0.7231
Previous Week's High/ Low: 0.7316/ 0.7158
Fundamental Overview:
Data released earlier today showed China Caixin/Markit Manufacturing Purchasing Managers' Index (PMI) rose to 52.0 in May, beating expectations for an unchanged 51.9 reading.
This was the highest level since December, reinstalling risk-on sentiment in the markets and thereby supporting the antipodeans.
US dollar index (DXY) remains on the back foot for the second consecutive day on early Tuesday after closing with a Gravestone Doji on Friday's trade.
Focus now remains on the key US PMI data ahead of Friday’s US Nonfarm Payrolls (NFP). US ISM Manufacturing PMI is likely to stay at 60.7 level.
Technical Analysis:
- GMMA indicator shows major and minor trend are strongly bullish
- Price action is above cloud and major moving averages
- Bearish divergence on RSI on the daily charts keeps scope for downside
- Oscillators are bullish, RSI is above 50 and biased higher
Major Support and Resistance Levels:
Support - 0.7225 (21-EMA), 0.72 (200-month MA), 0.7187 (55-EMA), 0.7128 (110-EMA)
Resistance - 0.73 (Psychological mark), 0.7312 (Upper BB), 0.74, 0.7464 (Yearly high)
Summary: NZD/USD is set to extend upside. Pullbacks have held above 55-EMA support. The pair is consolidating break above 200-month MA. Focus on US PMI data for impetus, any disappointment will prove counterproductive for the US dollar and could add to the NZD/USD upside.


