


 FxWirePro- Major European Indices
  Bitcoin’s Volatile Reset: ETFs Rebound as Bulls Eye USD 80,000 Milestone
  FxWirePro: GBP/USD bulls remain cautiously optimistic
  Ethereum Consolidates: Bullish Technicals Point to a Potential $3,000 Breakout
  FxWirePro: EUR/AUD under pressure as key support gives way
  Euro Holds the Line: EURUSD Finds Support at the 365-EMA as Peace Talks Loom
  FxWirePro: GBP/NZD down trend loses steam, remains on bearish path
  FxWirePro:NZD/USD uptrend loses momentum but bullish setup remains
  FxWirePro: USD/CAD extends decline on broad dollar weakness
  FxWirePro- Major Pair levels and bias summary
  FxWirePro- Woodies Pivot(Major)
  FxWirePro- Woodies Pivot(Major)
  FxWirePro: GBP/USD biased higher but rally currently stretched
  FxWirePro -Major European Indices
  Bitcoin’s Islamabad Watch: BTCUSD Consolidates Near 71,421 USD as Geopolitical Peace Talks Loom
  FxWirePro- Major Pair levels and bias summary


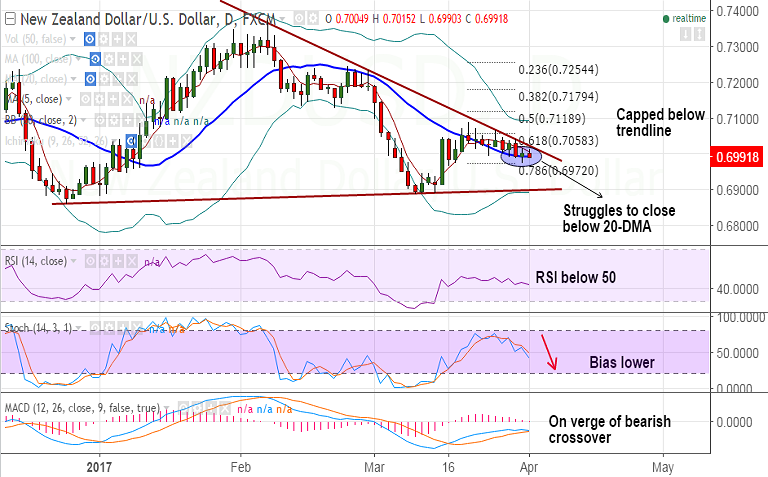
- NZD/USD trades with a bearish bias, scope for test of 0.69 ( trendline support).
- Price action is below daily cloud and major moving averages, technicals also bearish on intraday charts.
- The pair is struggling to close below 20-DMA support currently at 0.6993, weakness to extend on close below.
- On the flipside, break above trendline resistance at 0.7020 to see upside till upper Bollinger Band at 0.7093.
- No major NZ event risk during the week ahead, focus remains on GDT dairy auction on Tue.
- Futures pricing currently indicating a nil change (probably reflecting little change to auction volume).
- In the latest Monthly Economic Indicators March 2017 (MEI) published earlier on the day, NZ Treasury expects GDP growth to recover over 2017 after slowed in Q4 2016.
Support levels - 0.6993 (20-DMA), 0.6972 (78.6% Fib retrace of 0.68621 to 0.73756 rally), 0.6920 (88.6% Fib), 0.6890 (Mar 9 low)
Resistance levels - 0.7008 (5-DMA), 0.7020 (trendline), 0.7058 (61.8% Fib), 0.7089 (100-DMA)
TIME TREND INDEX OB/OS INDEX
1H Bearish Neutral
4H Bearish Neutral
1D Bearish Neutral
1W Bearish Neutral
Call update: We had advised a short call (http://www.econotimes.com/FxWirePro-NZD-USD-capped-below-major-trendline-resistance-good-to-go-short-on-rallies-617244).
Recommendation: Our call is progressing well. We recommend holding for targets.
FxWirePro Currency Strength Index: FxWirePro's Hourly NZD Spot Index was at -77.986(Bearish), while Hourly USD Spot Index was at 52.0137 (Neutral) at 0620 GMT. For more details on FxWirePro's Currency Strength Index, visit http://www.fxwirepro.com/currencyindex.


