


 FxWirePro: AUD/USD gains some ground but outlook is bearish
  FxWirePro: USD/JPY dips as market assess risk of additional FX intervention.
  JPY Currency Meter Signals: NZDJPY Bullish (+25) vs CHFJPY (-100) – These Pairs Could Move Next
  US Magnificent 7 Stocks Trend Score: Amazon & Microsoft Hit Extreme Bullish (+100) as Meta Drops to -100 — Key Resistance & Support Watchlist
  FxWirePro: NZD/USD consolidates overnight gains, but loses momentum
  FxWirePro: EUR/ AUD dips below 1.6400 level, focus on near term support
  FxWirePro: GBP/NZD remains weak, eyes 38.2%fib support
  NZDJPY Retreats on Yen Strength – Bearish Setup Targets 90 After Hitting 92.75 Low
  FxWirePro: AUD/USD cedes early gains ,outlook bearish
  FxWirePro- Major Pair levels and bias summary
  FxWirePro:USD/JPY climbs back above 160.00 after BOJ rate decision
  FxWirePro: USD/ZAR gains as stronger dollar outweighs upbeat South Africa's trade surplus
  FxWirePro- Major Crypto levels and bias summary
  FxWirePro: USD/CAD retreats after Canada posts stronger-than-expected GDP growth
  Nikkei Surges Past 65,000 on Suspected Yen Weakness: Tech Giants Like Advantest and NEC Lead Explosive Gains


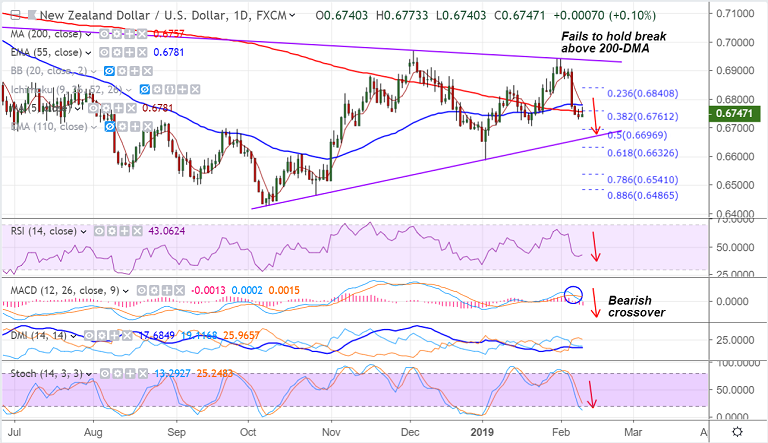
NZD/USD chart on Trading View used for analysis
- NZD/USD edges lower from session highs at 0.67733, intraday bias bearish.
- The pair is currently trading at 0.6748, up 0.11% at the time of writing.
- Price action failed to hold break above 200-DMA, scope for further weakness.
- Stochs are sharply lower, RSI is below 50, MACD shows a bearish crossover on signal line.
- Next major support lies at 0.6660 (major trendline). Violation there could see test of 61.8% Fib.
- We see stiff resistance in 0.6757 to 0.6781 zone. Break above could see upside resumption.
- Focus now on the RBNZ Monetary Policy Statement for further impetus. A dovish outcome would likely spark a fresh wave of selling around the kiwi.
For details on FxWirePro's Currency Strength Index, visit http://www.fxwirepro.com/currencyindex.


