


 EUR/USD Bounces from Monthly Low, But Bearish Pressure Remains
  FxWirePro: EUR/ AUD gains some ground , but remains on bearish path
  FxWirePro: EUR/AUD outlook weaker on renewed downside pressure
  FxWirePro: NZD/USD edges lower, remains on back foot
  FxWirePro: GBP/NZD maintains bersish bias with focus on 2.2900 level
  FxWirePro: USD/JPY eases ahead of Fed decision , Intervention risks linger
  Major Forex Pairs Action Bias: GBPUSD and AUDUSD Turn Extremely Bearish
  FxWirePro: AUD/USD dips after RBA Governor speech
  FxWirePro: USD/CAD runs out of steam but maintains bullish outlook
  FxWirePro: GBP/AUD gains some upside momentum but still bearish
  FxWirePro: GBP/AUD downside pressure builds, key support level in focus
  FxWirePro- Woodies pivot (Major)
  FxWirePro: GBP/USD edges higher as traders await BoE guidance and UK fiscal clarity
  FxWirePro: USD/ZAR retreats but trend is still bullish
  NZDJPY Pullback: Sell Rallies Toward 93.30 as Yen Weakness Eases


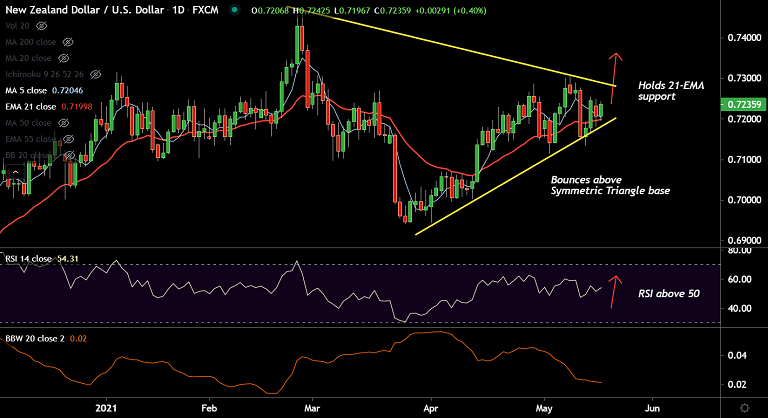
NZD/USD chart - Trading View
Technical Analysis: Bias turning Bullish
- NZD/USD was trading 0.39% higher on the day at 0.7234 at around 05:30 GMT
- RSI has turned north and is holding above 50 mark, Stochs show bullish momentum
- Price action is consolidating above daily cloud, Chikou span is biased higher
- The pair has bounced off Symmetric Triangle base and has edged above 200H MA
- 21-EMA is offering strong support at 0.72 mark, the pair is consolidating above 200-month MA
- Volatility is high and rising as evidenced by widening Bollinger bands
Support levels - 0.7227 (200H MA), 0.72 (21-EMA), 0.7166 (55-EMA)
Resistance levels - 0.7288 (Trendline), 0.73 (psychological mark), 0.7326 (Upper W BB)
Summary: NZD/USD consolidates around daily cloud and 200-month MA. Scope for upside resumption. Failure at 200-month MA negates any bullish bias.


