Home / Technicals / Article Technicals
Add as a preferred source on Google FxWirePro: NZD/USD hovers around 200-DMA, close below negates bullish bias NZD/USD chart on Trading View used for analysis NZD/USD retraces from 6-day highs at 1.68 mark, trades 0.16% lower at 1.6777 at 0600 GMT. Price action hovers around 200-DMA and close below will negate any bulish bias. RS…
By FxWirePro Team Jan 24, 2019, 6:07 AM UTC
Image from the original EconoTimes article Read the original article
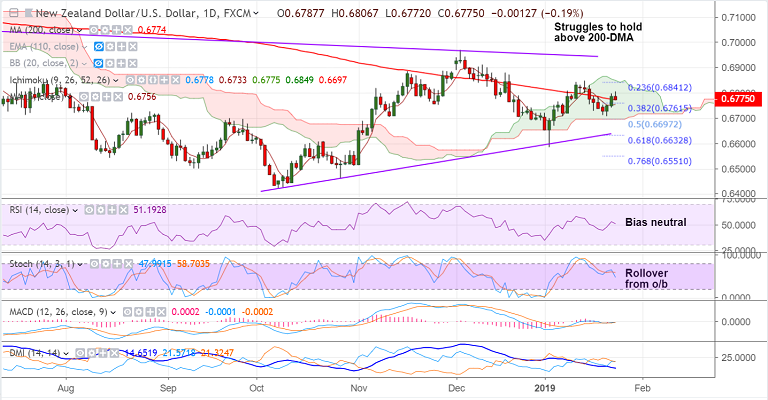
NZD/USD chart on Trading View used for analysis
NZD/USD retraces from 6-day highs at 1.68 mark, trades 0.16% lower at 1.6777 at 0600 GMT.
Price action hovers around 200-DMA and close below will negate any bulish bias.
RSI on daily charts is neutral, but Stochs are showing a rollover from overbought levels.
21-EMA is strong support at 0.6767, break below will confirm weakness.
Break below 21-EMA will take the pair lower till cloud base at 0.6697.
On the flipside, decisive breakout at 200-DMA will see further gains. Test of 0.6843 (Upper BB) then likely.
Support levels - 0.6774 (200-DMA), 0.6767 (21-EMA), 0.6757 (5-DMA)Resistance levels - 0.6843 (Upper BB), 0.6883 (Nov 16 high), 0.69For details on FxWirePro's Currency Strength Index, visit http://www.fxwirepro.com/currencyindex .
Technicals EURUSD - Levels to watch - 1.1100 GBPUSD Levels to watch - 1.3180 USDCHF Levels to watch - 0.8365 USDCAD - Levels to watch - 1.4300 AUDUSD - Levels to watch - 0.7000 NZDUSD - Levels to watch - 0.5560
By FxWirePro Team Oct 15, 2026, 3:20 AM UTC
Technicals EURUSD - Levels to watch - 1.100 GBPUSD Levels to watch - 1.3180 USDCHF Levels to watch - 0.8400 USDCAD - Levels to watch - 1.4300 AUDUSD - Levels to watch - 0.7000 NZDUSD - Levels to watch - 0.5560
By FxWirePro Team Oct 15, 2026, 3:17 AM UTC
Technicals JPY Major Pair Currency Score: USDJPY, GBPJPY and AUDJPY Extremely Bearish
By FxWirePro Team Oct 15, 2026, 2:34 AM UTC