


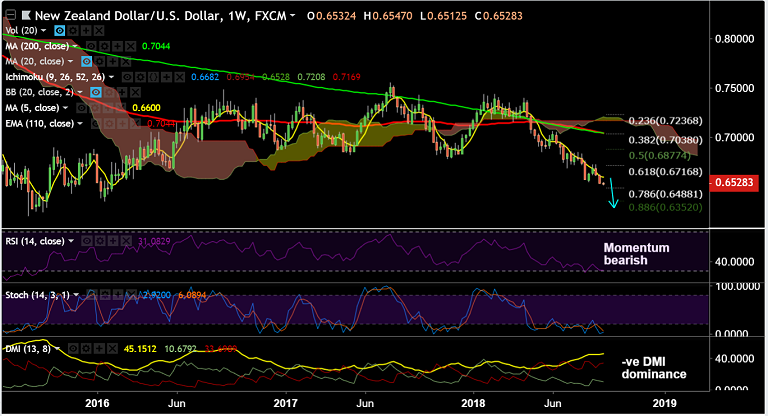
NZD/USD chart on Trading View used for analysis
- NZD/USD is trading in a narrow range on the day, with the days high at 0.6532 and low at 0.6517.
- Bears have paused above 0.65 handle, but technical studies are still biased lower.
- Further, the two-year US-NZ yield spread has hit a fresh all-time high, suggesting further weakness for the kiwi.
- NZ OIS pricing shows a 45% chance of a rate cut by mid-2019, with a rate hike not fully priced until May 2021.
- Technical studies show momentum still with the bears. We see scope for test of channel base support at 0.6470. Breach there could see further weakness.
- For the week ahead, focus will be on U.S. PPI and CPI releases that are key. Higher than expected CPI will underpin the case for higher rates from the Fed.
- Other key U.S. data in the week ahead include the JOLTS jobs, real weekly earnings, retail sales and industrial production.
Support levels - 0.6447 (Feb 2016 low), 0.64, 0.6347 (2016 low)
Resistance levels - 0.6556 (5-DMA), 0.66, 0.6627 (21-EMA)
FxWirePro Currency Strength Index: FxWirePro's Hourly NZD Spot Index was at -33.2486 (Neutral), while Hourly USD Spot Index was at -20.5365 (Neutral) at 0500 GMT. For more details on FxWirePro's Currency Strength Index, visit http://www.fxwirepro.com/currencyindex.


