


 FxWirePro- Woodies pivot (Major)
  FxWirePro- Major Crypto levels and bias summary
  BTC, ETH, SOL, XRP, and BNB: Major Crypto Pairs Stay Neutral
  FxWirePro: USD/ZAR retreats slightly but bias is bullish
  EUR/USD Slides After ECB Hold, Bearish Technicals Favor Rally Fades
  FxWirePro- Major Crypto levels and bias summary
  FxWirePro- Woodies pivot (Major)
  FxWirePro: GBP/AUD bears maintain upper hand
  FxWirePro: GBP/USD downtrend loses steam but outlook still bearish
  AUDJPY Extends Four-Day Rally on Yen Weakness: Bullish Dip-Buy Eyes 117-118
  Major Pairs Action Bias: USDCHF Emerges Extremely Bullish as EURUSD and GBPUSD Turn Deeply Bearish
  FxWirePro: EUR/NZD downside pressure builds, key support level in focus
  FxWirePro: USD/ZAR surges as rand slumps after SARB rate hold surprise
  NZDJPY Bullish Dip-Buy Setup: 93.60 Support Unlocks Path to 97
  FxWirePro: EUR/NZD firms after ECB holds rates steady at 2.25%
  FxWirePro: USD/CAD positions for another climb, eyes 1.4150 level


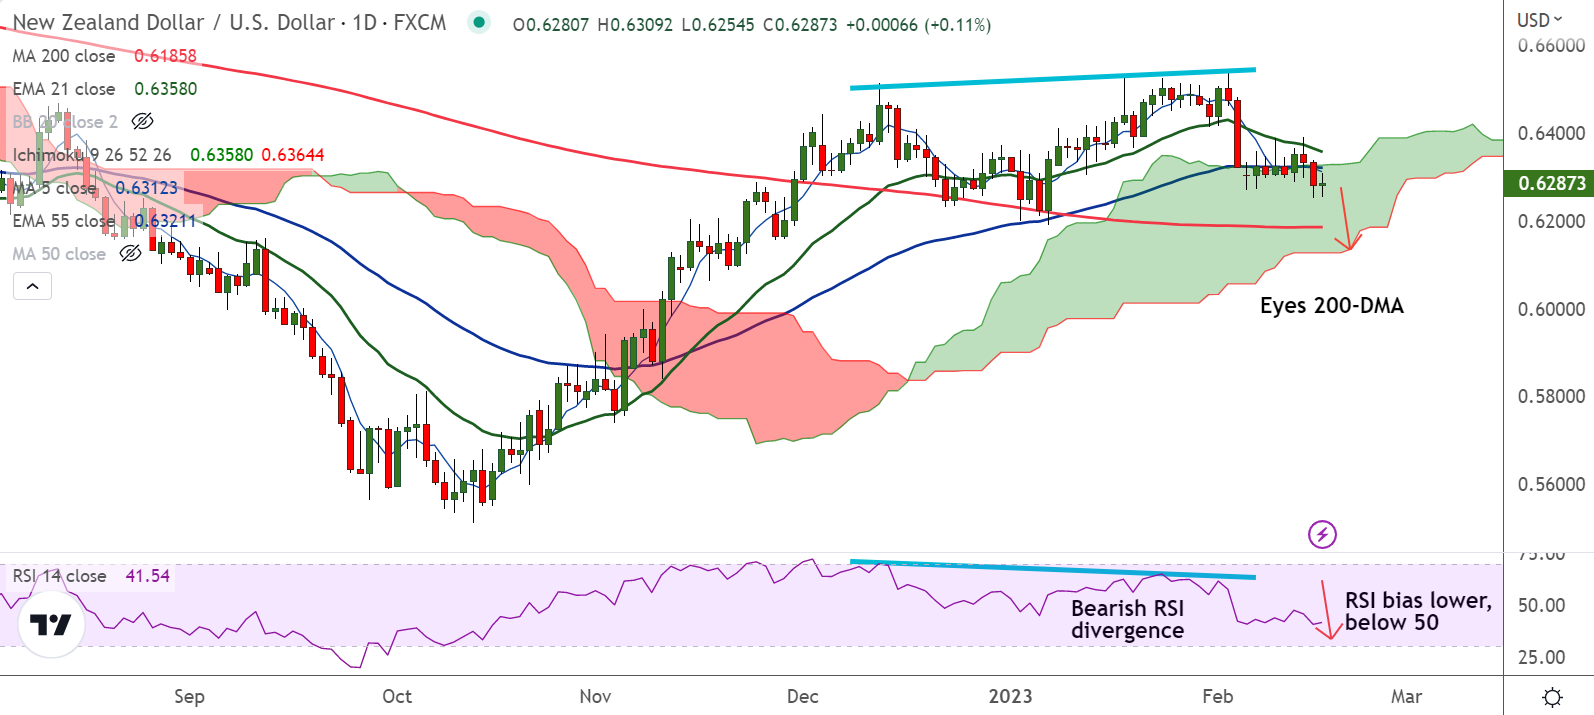
Chart - Courtesy Trading View
NZD/USD was trading 0.07% higher on the day at 0.6285 at around 11:20 GMT, forms Doji on the daily candle at the time of writing.
Data released on Wednesday showed US Retail Sales growth jumped to 3.0% YoY in January versus 1.8% expected and -1.1% prior. Core Retail Sales grew by 2.3%, beating estimates of +0.8%.
Further, NY Empire State Manufacturing Index for February improved to a three-month high of -5.8 versus -18.0 expected and -32.9 market forecasts. While, US Industrial Production came in at 0.0% MoM for January, missing estimates of 0.5% and -0.7% prior.
The pair is holding support at 110-EMA, but technical indicators support weakness in the pair.
Price action has broken consolidation around cloud top and 55-EMA and has slipped lower into the Ichimoku cloud.
Momentum is bearish and a bearish RSI divergence on the daily charts raises scope for further downside.
Price action is below cloud and GMMA indicator shows bearish trend on the intraday charts.
Support levels - 0.6259 (110-EMA), 0.6185 (200-DMA)
Resistance levels - 0.6320 (55-EMA), 0.6357 (21-EMA)
Summary: NZD/USD trades with a bearish bias. Watch out for break below 110-EMA for further weakness. Scope for test of 200-DMA at 0.6185.


