


 FxWirePro- Woodies pivot (Major)
  JPY Action Bias: USDJPY Emerges as the Clear Bullish Pair to Watch Amid Mixed Crosses
  EUR/JPY Holds Bullish Bias as Euro Extends Recovery
  FxWirePro: GBP/NZD gains some ground but bias is still bearish
  FxWirePro: USD/CAD gaining momentum for a move towards 1.4200 level
  FxWirePro : USD/JPY holds relatively bid on 163 ahead Of FOMC,BoJ meetings
  FxWirePro- Major Pair levels and bias summary
  GBPJPY Slips After Sterling Weakness, Bears Eye 216
  FxWirePro: USD/ZAR retreats but trend is still bullish
  FxWirePro: USD/CAD runs out of steam but maintains bullish outlook
  EUR/USD Bounces from Monthly Low, But Bearish Pressure Remains
  FxWirePro: GBP/USD edges higher as traders await BoE guidance and UK fiscal clarity
  NZDJPY Action Bias: Bullish Dip-Buying Opportunity on Broad Yen Weakness
  FxWirePro- Major Crypto levels and bias summary


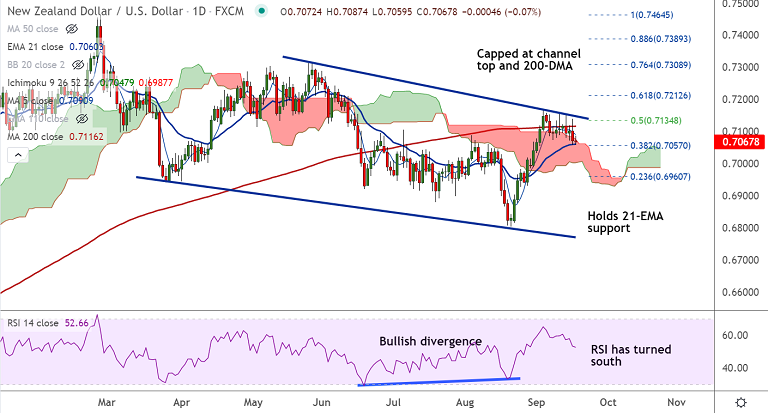
NZD/USD chart - Trading View
Spot Analysis:
NZD/USD was trading 0.06% lower on the day at 0.7068 at around 10:30 GMT
Previous Week's High/ Low: 0.7158/ 0.7075
Previous Session's High/ Low: 0.7139/ 0.7059
Fundamental Overview:
Upbeat US Retail Sales data which jumped to a 5-month high MoM and risk-off sentiment keep the greenback bid across the board.
The US Retail Sales MoM surpassed expectations of -0.8% with +0.7% in August.
Further, the Philly Fed business sentiment index also rose strongly to 30.7 versus 19 forecast and 19.4 prior, marking the strongest figures in three months.
Additionally, the US-China tussles, along with the hurricanes, challenge oil firms in the US Gulf to add to the risk-off mood and favor the US dollar’s safe-haven demand.
Investors now look to the Fed’s latest policy decision, due to be handed down next week, for further timeline clues.
Technical Analysis:
- Price action was rejected at channel top and is extending break below 200-DMA
- Downside has breached into daily cloud, but has held support at 21-EMA, breach below will drag the pair lower
- Momentum is turning bearish, RSI is now trending lower, but holds above the 50 mark
- Stochs have rolled over from overbought levels and are now biased lower
- GMMA shows minor trend is turning bearish, while major trend is neutral
Major Support and Resistance Levels:
Support - 0.7060 (21-EMA), Resistance - 0.7116 (200-DMA)
Summary: NZD/USD rejected at channel top, slips below 200-DMA. Price action has retraced into the daily cloud.
Downside is now pausing at 21-EMA support. Break below will plummet prices. Focus on US FOMC meeting for impetus.
On the flipside, decisive break above 200-DMA and channel top will buoy bulls in the pair.


