


 FxWirePro: EUR/AUD outlook weaker on renewed downside pressure
  JPY Action Bias: USDJPY Emerges as the Clear Bullish Pair to Watch Amid Mixed Crosses
  FxWirePro: USD/CAD runs out of steam but maintains bullish outlook
  FxWirePro: GBP/AUD gains some upside momentum but still bearish
  FxWirePro: GBP/USD edges higher as traders await BoE guidance and UK fiscal clarity
  JPY Pairs Action Bias: EURJPY Leads as Bullish Standout Amid Mixed Momentum
  FxWirePro: EUR/NZD up trend gains momentum but hurdles ahead
  EUR/JPY Holds Bullish Bias as Euro Extends Recovery
  EUR/USD Bounces from Monthly Low, But Bearish Pressure Remains
  FxWirePro- Woodies pivot (Major)
  FxWirePro: USD/ CNY remains soft ahead of Fed decision
  Major Forex Pairs Action Bias: GBPUSD and AUDUSD Turn Extremely Bearish
  NZDJPY Pullback: Sell Rallies Toward 93.30 as Yen Weakness Eases
  FxWirePro: EUR/ AUD gains some ground , but remains on bearish path
  FxWirePro: NZD/USD edges lower, remains on back foot
  FxWirePro: AUD/USD dips after RBA Governor speech


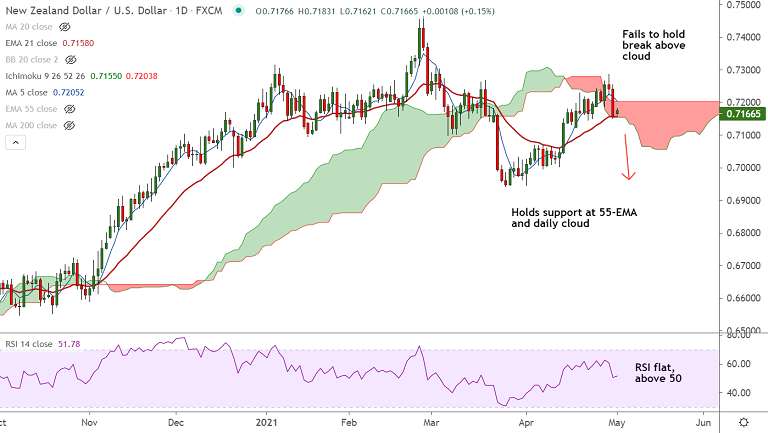
NZD/USD chart - Trading View
Spot Analysis:
NZD/USD was trading 0.06% higher on the day at 0.7159 at around 05:35 GMT.
Previous Week's High/Low: 0.7286/ 0.7150
Technical Analysis:
- Price action has failed to hold break above daily cloud
- Stochs are showing a rollover from overbought levels
- MACD is on verge of bearish crossover on signal line
- 5-DMA has turned, price action has slipped below 200H MA
- GMMA indicator show bearish shift on the hourly charts
Data Watch:
U.S. ISM PMIs (Monday 14:00 GMT)
New Zealand Unemployment Rate (Tuesday 22:45 GMT)
Support levels - 0.7157 (21-EMA), 0.7139 (55-EMA), 0.7082 (110-EMA)
Resistance levels - 0.7204 (5-DMA), 0.7286 (Apr 29 high), 0.73 (psychological mark)
Summary: The US manufacturing sector is expected to continue its uptick. US ISM PMI is forecast to rise to 65 in April from its 38-year high of 64.7 in March. Any disappointment in data will weigh on the USD supporting the pair higher. Technical bias is turning bearish. Watch out for breach below cloud and 55-EMA support for weakness. Scope for test of 110-EMA at 0.7082


