


 FxWirePro: GBP/USD heads deeper into bear territory, 23.6% fibonacci eyed
  U.S. Stocks vs. Bonds: Are Diverging Valuations Signaling a Shift?
  FxWirePro: AUD/USD eases after Australian mixed CPI data
  EURJPY Bounce Loses Steam Below 184 — Sell-the-Rally Setup Eyes 183 Target
  European Stocks Rally on Chinese Growth and Mining Merger Speculation
  Gold Prices Fall Amid Rate Jitters; Copper Steady as China Stimulus Eyed
  FxWirePro: GBP/USD slides toward critical support market reassesses UK political transition
  FxWirePro: USD/ZAR remains buoyant, looks to extend gains
  FxWirePro: GBP/AUD steadies around 0.9145 ,retains bid tone
  FxWirePro:NZD/USD rout continues without relief
  China’s Growth Faces Structural Challenges Amid Doubts Over Data
  NZDJPY Bears Reload as 92 Resistance Caps Bounce; Sell-on-Rallies Eyed Toward 90
  S&P 500 Relies on Tech for Growth in Q4 2024, Says Barclays
  AUDJPY Breaks Key Trendline Support — Bears Eye 110 as Momentum Accelerates
  US Futures Rise as Investors Eye Earnings, Inflation Data, and Wildfire Impacts
  UBS Projects Mixed Market Outlook for 2025 Amid Trump Policy Uncertainty
  Oil Prices Dip Slightly Amid Focus on Russian Sanctions and U.S. Inflation Data


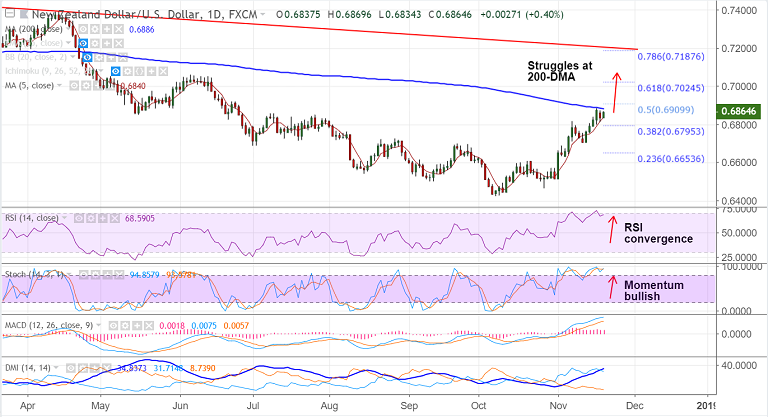
NZD/USD chart on Trading View used for analysis
- NZD/USD pauses upside at 200-DMA, bias remains bullish.
- Momentum studies are bullish, with nice convergence on RSI and Stochs.
- MACD and DMI also support upside in the pair. Scope for further upside on break above 200-DMA.
- On the weekly charts, price has broken above 55-EMA and Bollinger Bands are widening suggesting rise in volatility.
- Next immediate resistance above 200-DMA lies at 50% Fib at 0.69 ahead of 0.6979 (110W EMA) and 0.6989 (200W SMA).
- Rejection at 200-DMA could see drag till 20-DMA. Break below cloud negates bullish bias.
Support levels - 0.6811 (38.2% Fib), 0.6706 (Nov 12, 13 low), 0.6689 (20-DMA)
Resistance levels - 0.69 (50% Fib), 0.6979 (110W EMA), 0.6989 (200W SMA)
Recommendation: Stay long on break above 200-DMA, SL: 0.6830, TP: 0.69/ 0.6980
For details on FxWirePro's Currency Strength Index, visit http://www.fxwirepro.com/currencyindex.


