


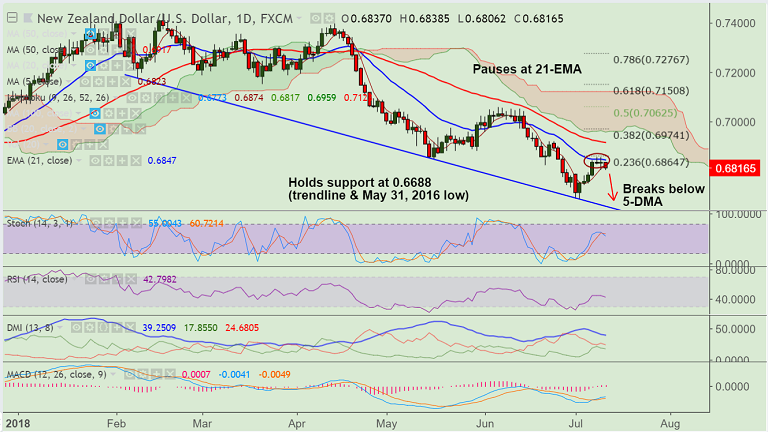
- NZD/USD breaks below 5-DMA support at 0.6822, trades 0.35% lower on the day.
- The major trend in the pair has been bearish and recovery was capped at 21-EMA.
- After brief consolidation below 21-EMA, we see that the pair is resuming weakness.
- Technical indicators on intraday charts are turning slightly bearish. Back-to-back dojis noted on the daily chart.
- Bearish divergence on the hourly charts keeps scope for downside. Price is currently hovering above 0.68 handle.
- Minor support seen at 4H cloud. Break below will see extension of downside. Scope for test of major trendline support at 0.6650.
- Further upside only on break above 21-EMA. Break out will see test of 50-DMA at 0.6917.
- Focus now will be on US CPI data for further impetus.
Support levels - 0.68, 0.6780 (Nov 17 low), 0.67, 0.6650 (trendline)
Resistance levels - 0.6822 (5-DMA), 0.6847 (21-EMA), 0.69, 0.6917 (50-DMA)
FxWirePro Currency Strength Index: FxWirePro's Hourly NZD Spot Index was at -100.697 (Bearish), while Hourly USD Spot Index was at 61.3453 (Neutral) at 0745 GMT. For more details on FxWirePro's Currency Strength Index, visit http://www.fxwirepro.com/currencyindex.


