


 FxWirePro: USD/CNY dips to hit three year low,scope for further downside
  FxWirePro: GBP/NZD remains weak, eyes 38.2%fib support
  China's Refining Industry Faces Major Shakeup Amid Challenges
  FxWirePro: AUD/USD dips below lower range, bearish bias increases
  U.S. Banks Report Strong Q4 Profits Amid Investment Banking Surge
  FxWirePro: GBP/AUD drifts lower after BOE rate decision
  China’s Growth Faces Structural Challenges Amid Doubts Over Data
  AUD/JPY Slips Below 112 as BOJ Intervention Sparks Bearish Momentum: Sell the Rallies
  Gold Prices Fall Amid Rate Jitters; Copper Steady as China Stimulus Eyed
  S&P 500 Relies on Tech for Growth in Q4 2024, Says Barclays
  Trump’s "Shock and Awe" Agenda: Executive Orders from Day One
  Global Markets React to Strong U.S. Jobs Data and Rising Yields
  FxWirePro: USD/JPY edges higher as focus shifts to BOJ decision
  Mexico's Undervalued Equity Market Offers Long-Term Investment Potential
  Indonesia Surprises Markets with Interest Rate Cut Amid Currency Pressure
  U.S. Treasury Yields Expected to Decline Amid Cooling Economic Pressures
  FxWirePro: NZD/USD consolidates overnight gains, but loses momentum


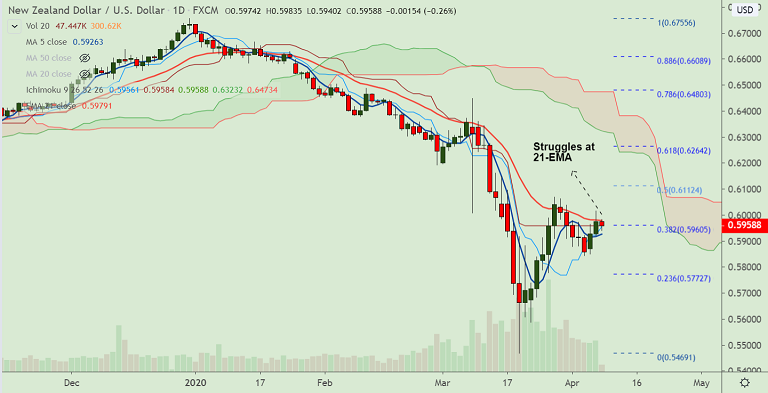
NZD/USD chart - Trading View
Fundamental Overview:
NZD/USD was trading 0.23% lower on the day at 0.5962 at around 05:05 GMT, snapping 2 straight sessions of gains.
The kiwi under pressure following comments from the RBNZ Assistant Governor that the central bank stands ready to increase the size of the QE.
Positive surprise from the GDT Price Index failed to buoy bulls. New Zealand’s GDT Price Index earlier rose beyond -3.9% prior contraction to +1.2% with a 2.1% gain in Whole Milk Powder (WMP) prices.
Trade sentiment remains weak after the latest swing in the coronavirus (COVID-19) numbers from global hotspots, namely the US, Europe and the UK.
Technical Analysis:
In favour of downside:
- Price action struggles at 21-EMA resistance.
- 'Death Cross' (bearish 50-DMA crossover on 200-DMA)
- Stochastics have approached overbought levels
- GMMA indicator shows major trend is bearish
In favour of upside:
- Bullish 5-DMA crossover on 20-DMA
- Price action has bounced off 200H MA support
- 5-DMA is biased higher and Stochastics show bullish momentum
Support levels - 0.5927 (5-DMA), 0.5907 (20-DMA)
Resistance levels - 0.5979 (21-EMA), 0.6068 (Mar 27 high)
Guidance: Intraday bias is neutral. Break out at 21-EMA could change near-term dynamics.


