


 NZDJPY Bullish Dip-Buy Setup: 93.60 Support Unlocks Path to 97
  FxWirePro: USD/ZAR retreats slightly but bias is bullish
  FxWirePro:USD/JPY hovers near a four-decade low
  FxWirePro: AUD/USD uptrend loses steam, remains on bearish path
  JPY Action Bias: USDJPY, EURJPY, and CADJPY Emerge as Top Extremely Bullish Picks
  FxWirePro: GBP/AUD under pressure as pound continues to weaken
  BTC, ETH, SOL, XRP, and BNB: Major Crypto Pairs Stay Neutral
  FxWirePro- Major Crypto levels and bias summary
  AUDJPY Extends Four-Day Rally on Yen Weakness: Bullish Dip-Buy Eyes 117-118
  Major Pairs Action Bias: USDCHF Emerges Extremely Bullish as EURUSD and GBPUSD Turn Deeply Bearish
  FxWirePro: USD/CNY edges higher but bulls lack punch
  FxWirePro: GBP/USD slips as middle east tensions and oil surge pressure pound
  EUR/USD Slides After ECB Hold, Bearish Technicals Favor Rally Fades
  FxWirePro: EUR/NZD firms after ECB holds rates steady at 2.25%
  FxWirePro: USD/ZAR surges as rand slumps after SARB rate hold surprise
  FxWirePro- Woodies pivot (Major)


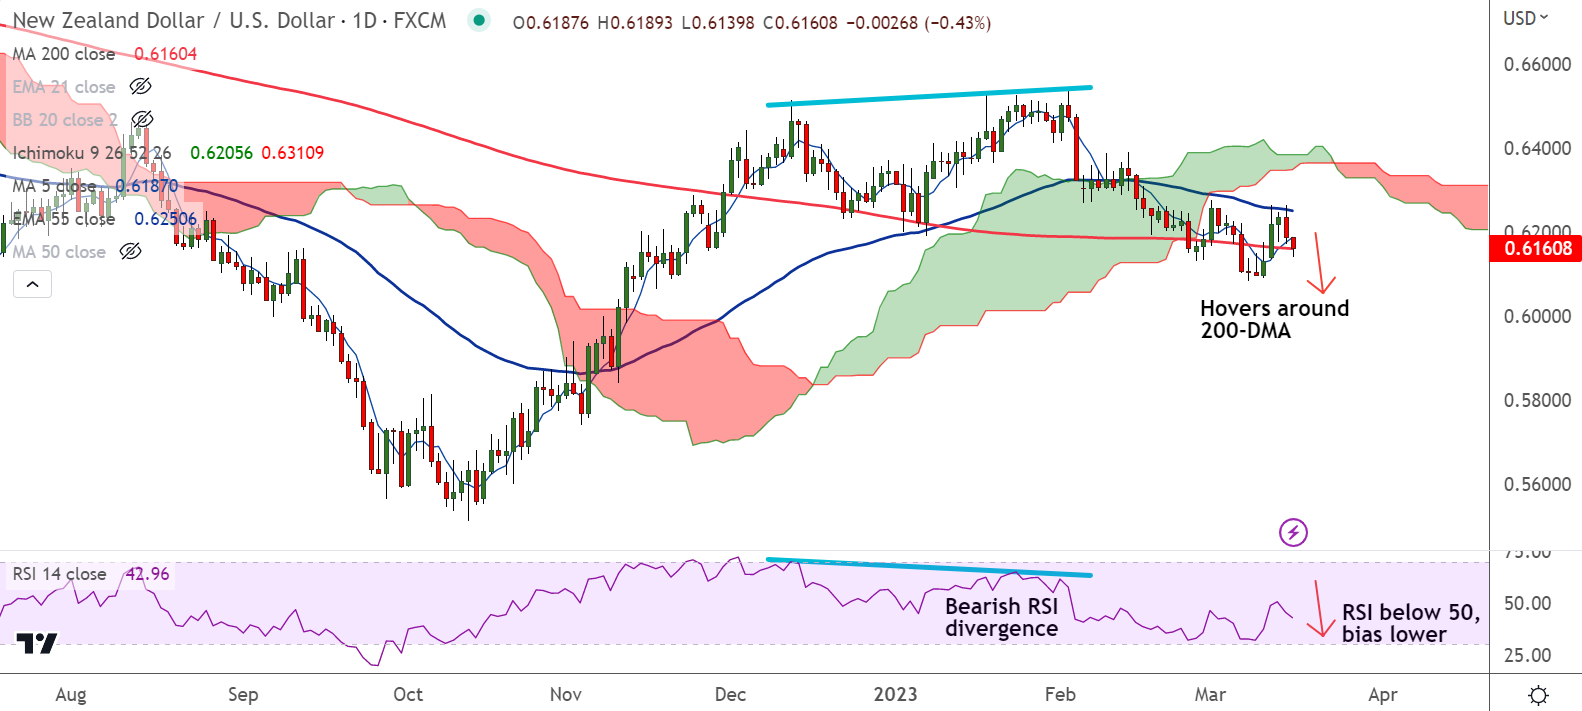
Chart - Courtesy Trading View
Spot Analysis:
NZD/USD was trading 0.36% lower on the day at 0.6165 at around 05:55 GMT.
Previous Week's High/ Low: 0.6225/ 0.6084
Previous Session's High/ Low: 0.6264/ 0.6172
Fundamental Overview:
Fears emanating from the latest bank fallouts in the US and Europe sent investors fleeing from riskier assets like the kiwi.
The New Zealand dollar takes an added hit from data showing the New Zealand economy contracted by a surprisingly sharp 0.6% in the December quarter.
Further, the YoY figures also eased to 2.2% compared to the 3.3% expected and 6.4% in previous readings.
Softer-than-expected GDP data raised fears of New Zealand credit rating cut, weighing further on the kiwi.
The poor result only reinforced the market move to pricing in fewer rate hikes from the Reserve Bank of New Zealand (RBNZ).
Swaps now implied a quarter-point hike in April was a 50-50 chance, compared to an absolute certainty a week ago.
Technical Analysis:
- NZD/USD rejected at 55-EMA, extends weakness for the 2nd straight session
- Price action is below cloud and Chikou span is biased lower
- RSI is below 50 mark and biased lower, volatility is low
- GMMA indicator has turned bearish on the intraday charts
Support Levels:
S1: 0.6160 (200-DMA)
S2: 0.6093 (Lower BB)
Resistance Levels:
R1: 0.6189 (converged 5 and 20 DMA)
R2: 0.6206 (21-EMA)
Summary: NZD/USD pivotal at 200-DMA support. Decisive break below will drag the pair lower. On the flipside, bounce off 200-DMA will see sideways grind in the pair for the next few sessions.


