


 AUDJPY Action Bias: Bullish Dip-Buy Setup Despite Flat Neutral Bias
  FxWirePro: NZD/USD edges lower, remains on back foot
  NZDJPY Action Bias: Bullish Dip-Buying Opportunity on Broad Yen Weakness
  FxWirePro: GBP/AUD under pressure as pound continues to weaken
  FxWirePro: EUR/NZD downside pressure builds, key support level in focus
  FxWirePro: EUR/AUD outlook weaker on renewed downside pressure
  FxWirePro: USD/ZAR retreats but trend is still bullish
  JPY Action Bias: USDJPY Emerges as the Clear Bullish Pair to Watch Amid Mixed Crosses
  JPY Action Bias: Bullish Pairs to Watch Out For
  FxWirePro: NZD/USD gains as U.S.-Iran peace hopes boost risk sentiment
  FxWirePro: GBP/AUD downside pressure builds, key support level in focus
  FxWirePro: AUD/USD dips after RBA Governor speech
  FxWirePro: USD/CAD gaining momentum for a move towards 1.4200 level
  FxWirePro: GBP/NZD gains some ground but bias is still bearish
  FxWirePro: USD/CNY dips as yuan firms on improving risk appetite
  FxWirePro: GBP/NZD downside pressure builds, key support levels in focus
  Major Pair Action Bias: Bullish Pairs to Watch Out For


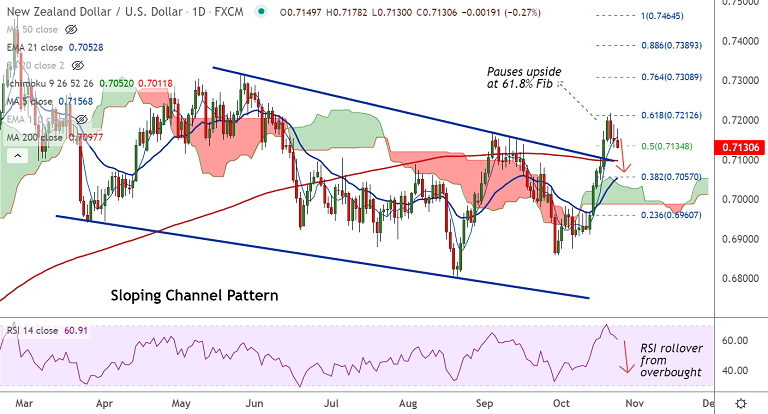
NZD/USD chart - Trading View
Technical Analysis: Bias Bearish
- NZD/USD was trading 0.25% lower on the day at 0.7132 at around 10:00 GMT
- Price action was rejected at session highs, slips below 5-DMA
- RSI has confirmed a bearish rollover from overbought levels
- Upside in the pair has paused at 61.8% Fib retracement
- Longer upper wicks on daily candles suggests selling pressure at highs
Support levels - 0.7134 (50% Fib), 0.71 (200H MA), 0.7097 (200-DMA)
Resistance levels - 0.7158 (5-DMA), 0.72, 0.7212 (61.8% Fib)
Summary: NZD/USD is extending weakness for the 3rd consecutive session. US dollar shows some bounce across the board as the Treasury yields recover ground. NZD/USD poised to test 0.71 levels. Break below will see further weakness.


