


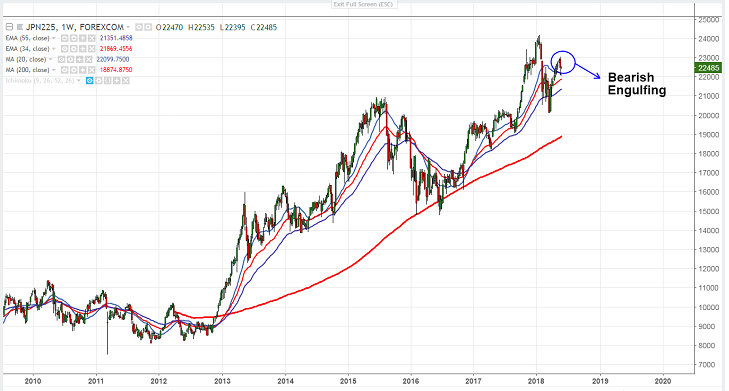
Candlestick pattern formed- Bearish Engulfing pattern (Weekly chart)
- Asian markets are trading slightly weak especially Nikkei in previous week due to strong Yen. The geopolitical tensions slightly eased on revived hopes for US-N.Korea summit. Trump Said on Sunday a US team arrived in North Korea to prepare for a proposed summit between US and North Korea. Dow Jones was trading flat and closed around 24753 (0.24% lower)/2721 (0.24% lower). US futures is trading marginally positive with Dow Jones at 24815 (0.35% higher) and S&P500 2728 (0.39% higher). It is currently trading around 22490 0.69% higher.
- USD/JPY has declined more than 200 pips from the high of 111.39 in previous on account of increasing geopolitical tensions. The pair is trading well below 200- day MA. Any further weakness can be seen if it breaks below 109. It is currently trading around 109.52.
- On the lower side, index major support is around 22257 (55- day EMA) and any break below will drag the index down till 22000 (38.2% fib)/21697 (Apr 13th low).
- The near term resistance is around 22600 (20- day MA) and any break above will take the index to next level till 23000/23200.
It is good to sell on rallies around 22600-650 with SL at 22800 for the TP of 22300/22065.


