


 FxWirePro- Major Pair levels and bias summary
  FxWirePro- Major Pair levels and bias summary
  FxWirePro: USD/CAD retreats slightly but trend is still bullish
  FxWirePro: GBP/NZD gains some upside momentum but still bearish
  FxWirePro- Woodies pivot (Major)
  ETHUSD Breaks Above $1900 as Bulls Eye $2300 and Beyond
  FxWirePro: USD/CNY gains some upside momentum but bias still bearish
  Major Crypto Action Bias: ETHUSD Turns Bullish – Only Bullish Pair to Watch
  FxWirePro: EUR/ AUD downtrend loses steam, remains on bearish path
  FxWirePro: EUR/ AUD dips below 1.6300 level, focus on near term support
  GBPJPY Weakens on Soft UK CPI: Sell Below 217.80 Targeting 216.40
  NZDJPY Pulls Back on Kiwi Weakness: Buy Dips at 94.40 Targeting 97
  JPY Action Bias: USDJPY, AUDJPY & EURJPY Turn Extremely Bullish – Top Pairs to Watch
  FxWirePro: GBP/USD stays below 1.3400 level following cooler inflation report
  FxWirePro: USD/CAD retains bid tone,eyes 1.4200 level
  FxWirePro- Major Crypto levels and bias summary
  Major Pair Action Bias: USDCHF Turns Bullish as EURUSD Stays Bearish – Key Pairs to Watch


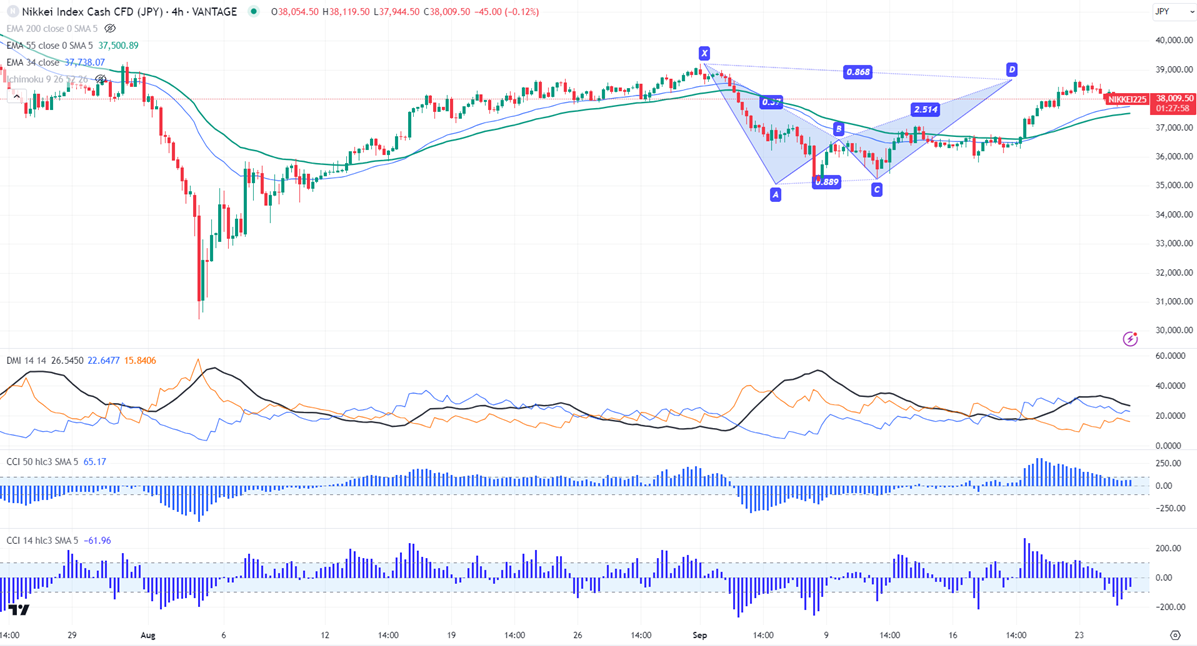
Harmonic pattern- Bearish BAT pattern
Potential Reversal Zone (PRZ)- 39200
Nikkei pared some of its gains due to profit booking. It hits a low of 37660 yesterday and is currently trading around 38009.
he index holds above short-term 34 and 55 EMA and long-term moving averages (200- EMA) in the 4-hour chart.
The near-term resistance is around 38700, any violation above will take the index to 39000/39200/39500/40000—overall bullish continuation only above 42550.
On the lower side, immediate support stands around 37800, any breach below will drag the index down to 37500/37200/37000/36800—further bearishness only below 35000.
Indicator (4- hour chart)
CCI (14)- Bearish
CCI (50)- Bullish
Average directional movement Index - Neutral
It is good to sell on rallies around 38480-500 with SL around 39000 for TP of 36800.


