


 FxWirePro:NZD/USD uptrend loses momentum but bullish setup remains
  FxWirePro: USD/ZAR recovers slightly but trend is still bearish
  FxWirePro: USD/ZAR edges lower ,investors remain on edge
  FxWirePro: GBP/AUD positions for another drop, eyes 1.8900level
  Ethereum Consolidates: Bullish Technicals Point to a Potential $3,000 Breakout
  FxWirePro: EUR/AUD downtrend loses steam but outlook still bearish
  FxWirePro: GBP/USD bulls remain cautiously optimistic
  FxWirePro: EUR/CAD gains ground on prospects of resumed energy flows
  FxWirePro: USD/CAD recovers slightly but bearish outlook persists
  FxWirePro: USD/JPY holding bid into weekend
  NZDJPY Bulls Charge Toward 95.00: Safe-Haven Exodus Drives Kiwi Rally
  FxWirePro: EUR/AUD under pressure as key support gives way
  FxWirePro: GBP/NZD up trend gains some momentum but hurdles ahead
  FxWirePro- Woodies Pivot(Major)
  Euro Holds the Line: EURUSD Finds Support at the 365-EMA as Peace Talks Loom
  FxWirePro: GBP/NZD down trend loses steam, remains on bearish path


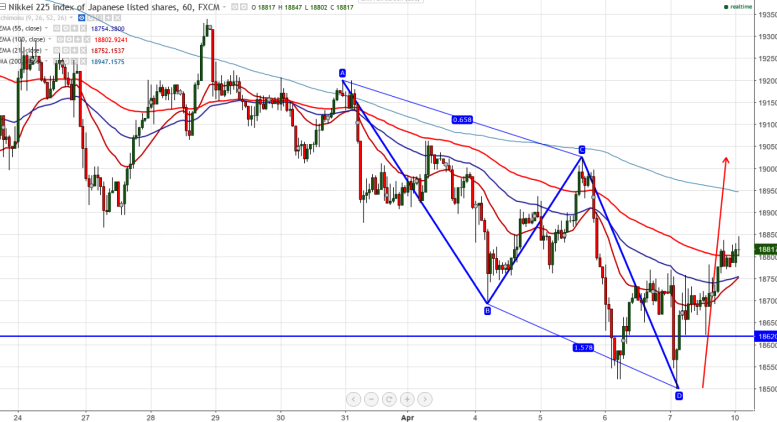
- Harmonic chart pattern - Bullish AB=CD .
- Nikkei has recovered slightly after making a low of 18500 on Friday. The index declined sharply on Friday on account of geopolitical risk along with expensive valuation.It is currently trading at 18808 at 0.16% higher.
- U.S missile attack against Syria's Assad has rattled equity markets and pushed gold ,oil higher.
- USD/JPY has once again recovered after making a low of 110.09 and any weakness can be seen only below 110. It is currently trading around 111.45.
- On the lower side , 18500 will be acting as major support for Nikkei and any break below will drag the index till 18325 ( 61.8% retracement of 16106 and 16698)/18000 .
- The major resistance is around 18860 (100- day EMA ) and any break above will take the index till 19083 (21- day EMA)/19200/19365 ( 61.8% retracement of 19669 and 18867).
It is good to buy on dips around 18750 with SL around 18500 for the TP of 19080/19200.


