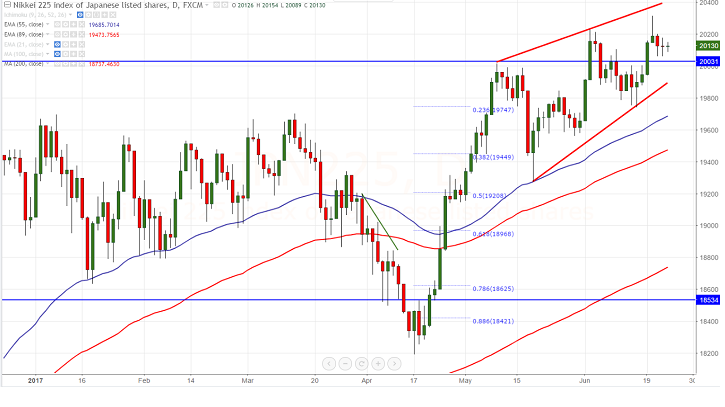
FxWirePro: Nikkei225 forms shooting star chart in daily chart , good to sell on rallies
Nikkei has slightly declined after hitting 2- year high of 20319 on account weak oil prices and equities sell off. The index formed a minor bottom at 20064 on Wednesday . It is currently trading around 20124 0.03% lower.…
Nikkei has slightly declined after hitting 2- year high of 20319 on account weak oil prices and equities sell off. The index formed a minor bottom at 20064 on Wednesday . It is currently trading around 20124 0.03% lower..
USD is consolidating around 111.77 and 110.95 for the past three trading session. The pair is facing strong resistance at 111.85 (100- MA) and any break above confirms bullish continuation.It is currently trading around 111.38.
On the lower side, near term support is around 19880 (trend line joining 19277 and 19744) and any break below will drag the index down till 19669 (55- EMA)/19458 (89 EMA)/19277 (May 18th 2017 low).
The near term resistance of Nikkei is around 20477 (161.8% retracement of 20019 and 19277) and break above will take the index to recent high of 20530 (161.8% retracement of 20220 and 19744)/20649 (161.8% retracement of 19698 and 18193).
Short term bullish invalidation only below 19275
It is good to sell on rallies around 20150-20170 with SL around 20320 for the TP of 19458/19277.