
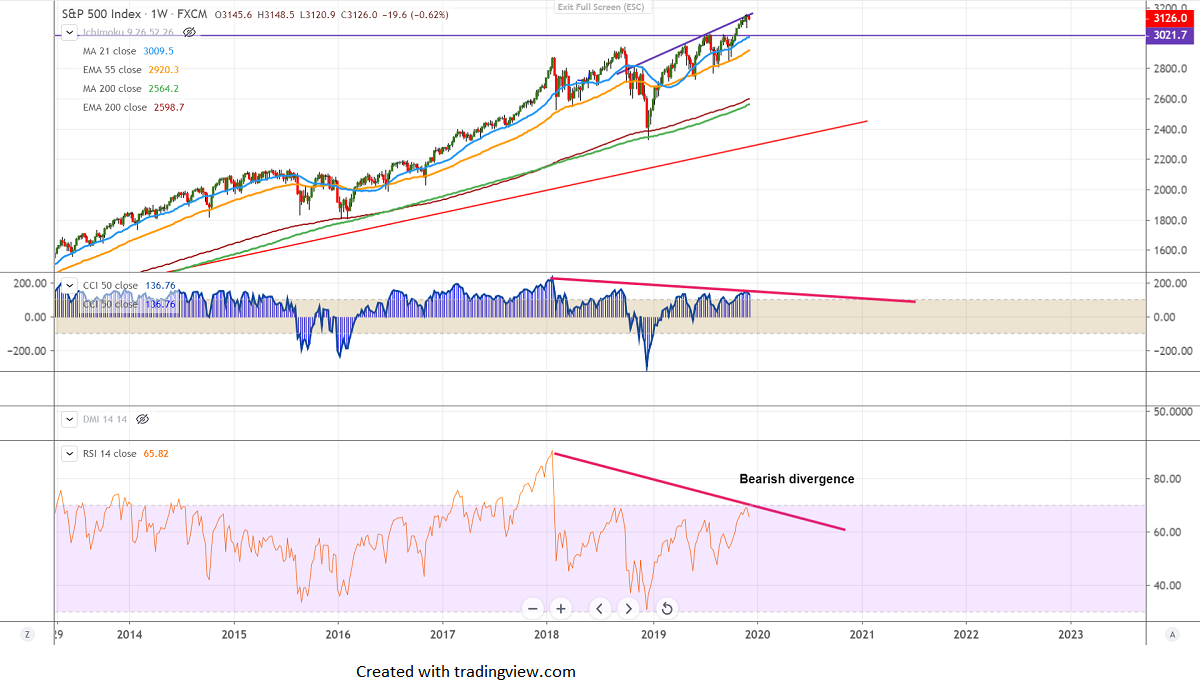
Major resistance- 3160
Chart pattern- Bearish divergence
S&P500 was one of the best performers this year and jumped more than 30%. The index bullishness was mainly due to US-China trade talks and US Fed policy. Both major countries are negotiating for the past year but unable to reach a deal. Global stocks are holding higher as investors hope that phase one deal will happen within this year. It hits high of 3157 and is currently trading around 3123.
US Fed has cut interest rates three times this year on weak economic data and expected to hold for a while. The US 10-year yield has dropped more than 50% this year, the yield curve got inverted for the first time since 2007.
Technically, near term major resistance is at 3160 and any indicative break beyond targets 3180/3200.
On the flip side, major support stands at 3060 (10 -W MA) and violation beneath confirms minor weakness, a dip till 3000/2965 likely.
It is good to sell on rallies around 3130-35 with SL around 3161 for the TP of 3000.


