
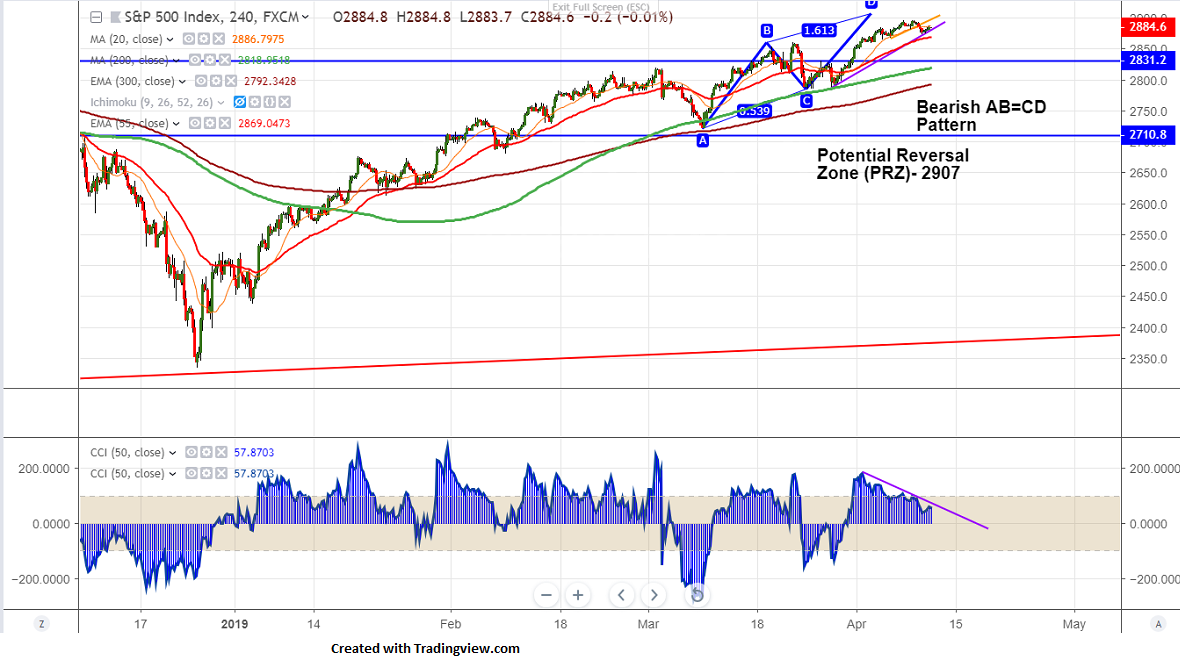
Harmonic Pattern- Bearish AB=CD Pattern
Potential Reversal Zone (PRZ)- 2907
S&P500 is trading in narrow range after jump of more than 3.5% in past one week. It hits high of 2891 and is currently trading around 2881.70. The global growth forecast cut by IMF and escalation of trade tension between US and Europe is slightly putting pressure on global stock markets. Markets eye Fed meeting minutes and EU Brexit summit for further direction.
On the lower side, near term support is around 2870 (23.6% fib) and any violation below will drag the index to next level till 2820/2791.Any break below 2790 confirms further weakness.
The near term resistance is around 2907 and any break above that level will take the index till 2940/2970 level Any bullish continuation only above 3000.
It is good to sell on rallies around 2905-07 with SL around 2940 for the TP of 2820/2792.


