


 FxWirePro- USD/CHF Holds Above 0.8120 as Bulls Target 0.8200
  Major Crypto Action Bias: ETHUSD Turns Bullish – Only Bullish Pair to Watch
  ETHUSD Breaks Above $1900 as Bulls Eye $2300 and Beyond
  NZDJPY Pulls Back on Kiwi Weakness: Buy Dips at 94.40 Targeting 97
  FxWirePro: USD/CAD retains bid tone,eyes 1.4200 level
  JPY Action Bias: USDJPY, AUDJPY & EURJPY Turn Extremely Bullish – Top Pairs to Watch
  FxWirePro: GBP/AUD downtrend loses steam but outlook still bearish
  FxWirePro: USD/CAD retreats slightly but trend is still bullish
  FxWirePro: USD/ZAR slips as rand gains on U.S.-Iran developments
  FxWirePro- Major Pair levels and bias summary
  Major Pair Action Bias: USDCHF Turns Bullish as EURUSD Stays Bearish – Key Pairs to Watch
  FxWirePro: USD/CNY gains some upside momentum but bias still bearish
  FxWirePro: GBP/NZD gains some upside momentum but still bearish
  FxWirePro: GBP/AUD dips amid heightened Geopolitical concerns
  FxWirePro:USD/JPY hovers near 40-year peak,intervention fears linger


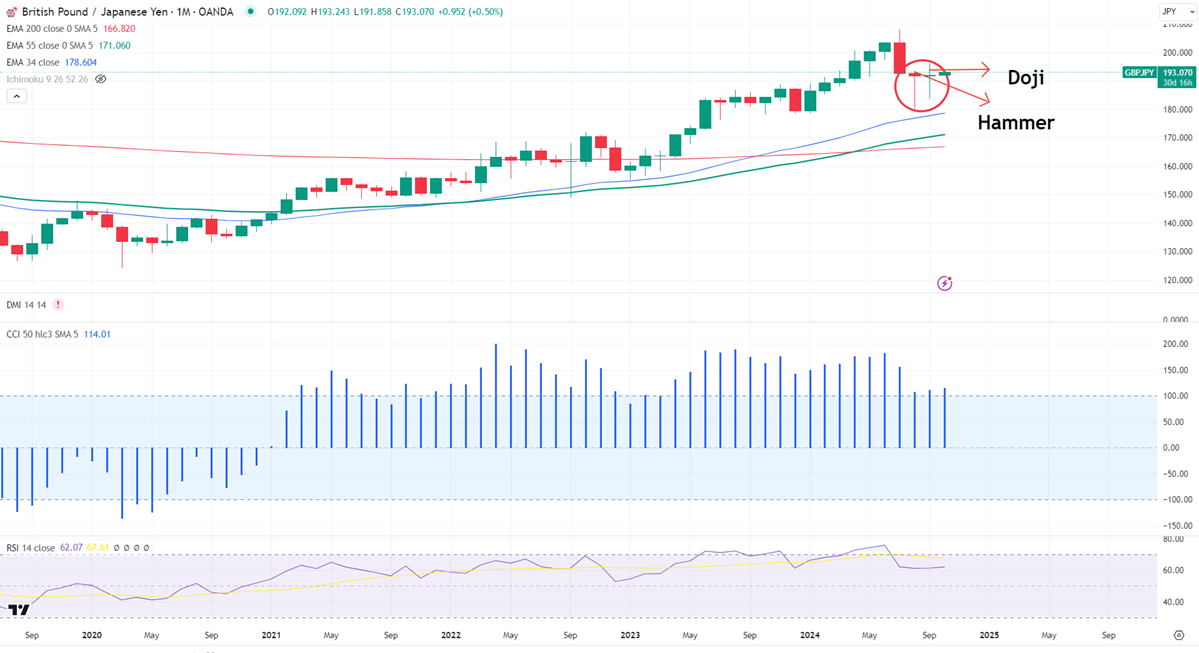
Candlestick Pattern- Hammer (Aug month), Doji (Sep)
GBPJPY once recovered sharply from a minor bottom of 189.56 on a weak yen. It hit a high of 193.24 at the time of writing and is currently trading around 193.16. Overall trend remains bullish as long as support 188 holds.
Technicals-
The pair is trading above short term 34,above 55 EMA (177.72 and 170.24) and long term 200 EMA (166.55) in the monthly chart.
The near-term resistance is around 193.50 ,a breach above targets 194.25/195/195.97. Major trend continuation only above 196. The immediate support is at 192.50, any violation below will drag the pair to 191.50/190/188/185.85
Indicator (Monthly chart)
CCI (50)- Bullish
RSI- 62.15. All indicators confirms bullish trend .
It is good to sell on rallies around 193 with SL around 196 for a TP of 185.90.


