


 Pound Under Pressure as Yen Stabilizes: GBPJPY Bears Target 208 as Key EMAs Hold Resistance
  FxWirePro- Major European Indices
  FxWirePro: USD/JPY firms as Trump's address on Gulf war spark fresh concerns
  Ethereum Joins the Rally: ETH Reclaims USD 2,100 Following Bitcoin's Lead
  Bitcoin Resilience: BTC Reclaims USD 69,000 as Geopolitical Tensions Ease
  FxWirePro: GBP/USD outlook weaker on renewed downside pressure
  FxWirePro- Major Pair levels and bias summary
  FxWirePro: AUD/USD recovers slightly from early decline but bears are not done yet
  Ethereum Retreats Toward USD 2,000: Technicals Signal Caution as ETH Mimics Bitcoin’s Pullback
  FxWirePro- Woodies Pivot(Major)
  Kiwi Under Pressure: NZDJPY Signals Bearish Turn as Resistance at 92.00 Holds Firm
  FxWirePro- Major European Indices
  FxWirePro: USD/JPY holds range near 160 as intervention risks loom
  FxWirePro- Major Crypto levels and bias summary
  FxWirePro: GBP/NZD remains buoyant, looks to extend gains


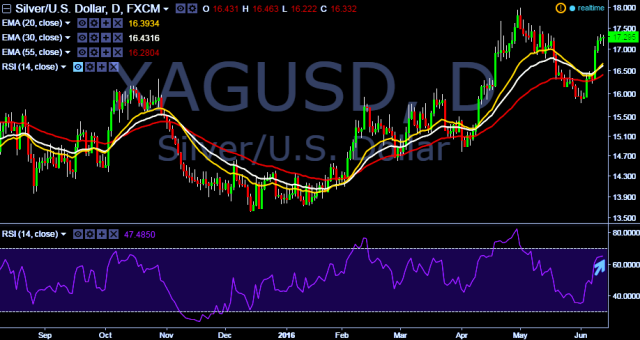
- XAG/USD is currently trading around $17.28 marks.
- It made intraday high at $17.34 and low at $17.08 levels.
- Intraday bias remains bullish till the time pair holds key support at $16.88 marks.
- A daily close below $17.00 will take the parity down towards key support at $16.88, $16.76, $16.63 and $16.32 marks respectively.
- On the other side, a sustained close above $17.32 tests key resistances at $17.45, $17.52 and $17.80 marks respectively.
- Important to note here that in a daily chart, 20D, 30D and 55D EMA heads up and confirms bullish trend. Current downside movement is short term trend correction only.
We prefer to take long position in XAG/USD only above $17.35, stop loss $17.22 and target $17.52/ $17.80 marks.


