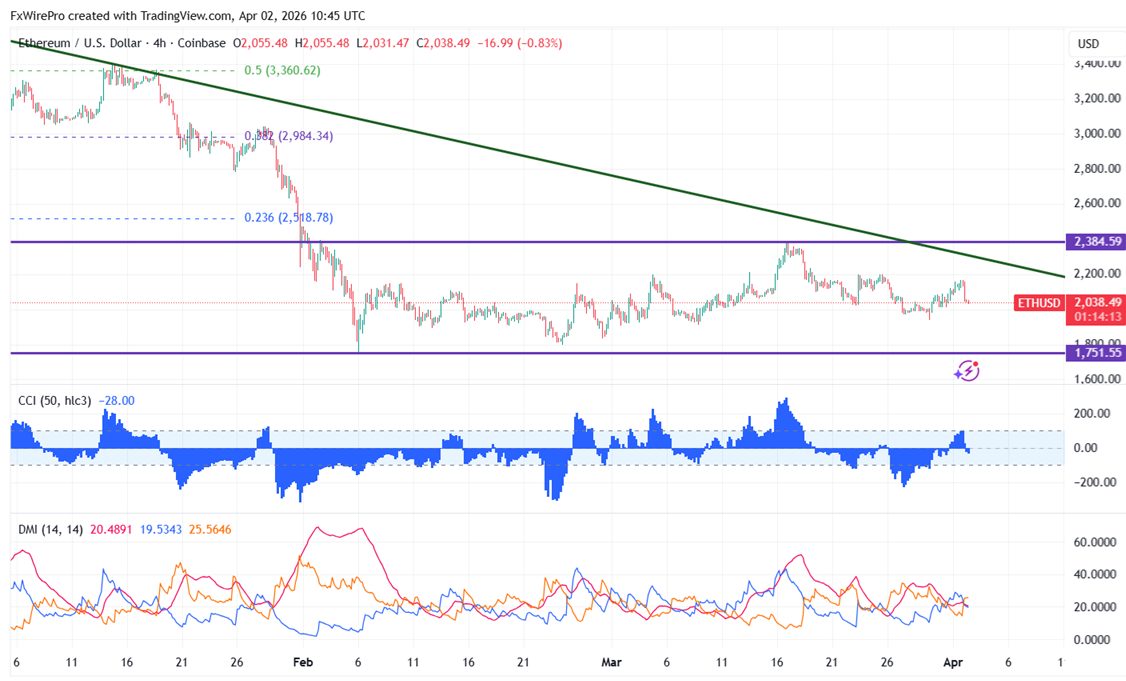
Ethereum pared some of its gains following the footsteps of BTC. It is presently floating at around $2037, following reaching a high of $2167 yesterday.
|
Technicals |
CMP -$2037 |
Trend |
|
|
4- Hour chart |
Value |
|
|
|
55 EMA |
$2077 |
CMP < 55 EMA |
Bearish |
|
200- EMA |
$2104 |
CMP <200- EMA |
Bullish |
|
365- EMA |
$2213 |
CMP < 365 EMA |
Bearish |
Major support- $1700/$1500. Minor bullishness only above $2200. Any violation above targets $2386/$2500/$2700/$2880/$3000.
|
Momentum indicator (4-hour chart) |
Inference |
Value |
|
CCI(50) |
Bearish |
-18 |
|
ADX |
Neutral |
|
It is good to buy on dips around $2000 with SL around $1700 for a TP of $2770.



FxWirePro: GBP/NZD slide extends ,eyes 2.2600 level
Bitcoin Bleeds $704M in ETF Outflows as Institutional Exodus Accelerates
FxWirePro- Major Crypto levels and bias summary
Ethereum Cracks Below $2,000 as Bitcoin Contagion Bites—Bearish EMA Stack Sets Sights on $1,700
FxWirePro- Major Crypto levels and bias summary
FxWirePro: USD/CAD bulls continue to hold the higher ground
FxWirePro: EUR/ NZD dips below lower range, bearish bias increases
FxWirePro- Major Pair levels and bias summary
FxWirePro- Major Crypto levels and bias summary
FxWirePro: GBP/AUD downside pressure builds, key support level in focus
FxWirePro: USD/JPY edges higher but bulls lack punch
FxWirePro: GBP/NZD extends decline , vulnerable to more downside 


