


 FxWirePro: USD/JPY holding bid into weekend
  FxWirePro- Major European Indices
  FxWirePro: AUD/USD retreats slightly but trend is still bullish
  FxWirePro: EUR/CAD gains ground on prospects of resumed energy flows
  FxWirePro: USD/ZAR edges lower ,investors remain on edge
  FxWirePro: GBP/USD biased higher but rally currently stretched
  FxWirePro- Major Crypto levels and bias summary
  Euro Holds the Line: EURUSD Finds Support at the 365-EMA as Peace Talks Loom
  FxWirePro: EUR/AUD under pressure as key support gives way
  Bitcoin’s Volatile Reset: ETFs Rebound as Bulls Eye USD 80,000 Milestone
  FxWirePro: EUR/AUD downtrend loses steam but outlook still bearish
  FxWirePro: USD/CAD extends decline on broad dollar weakness
  FxWirePro: USD/ZAR recovers slightly but trend is still bearish
  FxWirePro: GBP/AUD gains some upside momentum but still bearish
  NZDJPY Bulls Charge Toward 95.00: Safe-Haven Exodus Drives Kiwi Rally


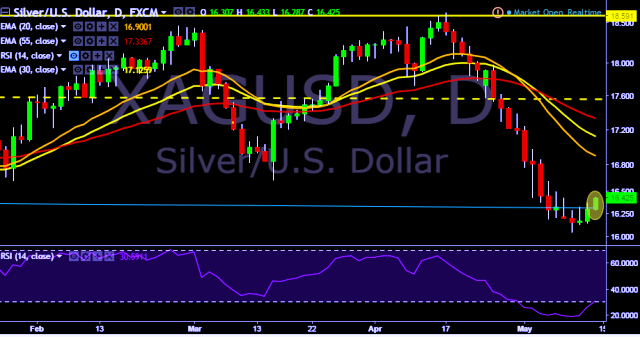
- XAG/USD is currently trading around $16.42 marks.
- It made intraday high at $16.43 and low at $16.28 levels.
- Intraday bias remains slightly bullish till the time pair holds key support at $16.30 mark.
- A daily close above $16.30 will test key resistances at $16.42/$16.49/$16.62/$16.86/$16.98/$17.24/$17.40/$17.47/$17.63/$17.72/$17.98 marks respectively.
- On the other side, a daily close below $16.30 will take the parity down towards key supports at $16.14/$16.04/$15.80/$15.66 marks respectively.
- Important to note here that 20D, 30D and 55D EMA heads down and confirms the bearish trend in a daily chart. Current upside movement is short term trend correction only.
We prefer to go short on XAG/USD around $16.45 with stop loss at $16.61 and target of $16.04/$15.80.


