


 FxWirePro: EUR/AUD under pressure as key support gives way
  FxWirePro: GBP/AUD positions for another drop, eyes 1.8900level
  FxWirePro: GBP/NZD down trend loses steam, remains on bearish path
  FxWirePro: AUD/USD retreats slightly but trend is still bullish
  FxWirePro- Major Pair levels and bias summary
  FxWirePro- Major European Indices
  FxWirePro: USD/ZAR recovers slightly but trend is still bearish
  FxWirePro: USD/CAD recovers slightly but bearish outlook persists
  FxWirePro- Woodies Pivot(Major)
  FxWirePro: EUR/CAD gains ground on prospects of resumed energy flows
  Euro Holds the Line: EURUSD Finds Support at the 365-EMA as Peace Talks Loom
  NZDJPY Bulls Charge Toward 95.00: Safe-Haven Exodus Drives Kiwi Rally
  FxWirePro: EUR/AUD downtrend loses steam but outlook still bearish
  FxWirePro: GBP/USD bulls remain cautiously optimistic
  FxWirePro- Major Pair levels and bias summary


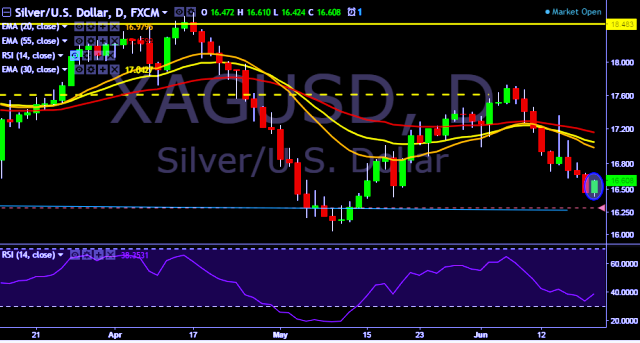
- XAG/USD is currently trading around $16.60 marks.
- It made intraday high at $16.61 and low at $16.42 levels.
- Intraday bias remains slightly bullish for the moment.
- A daily close above $16.47 will test key resistances at $16.62/$16.75/$16.95/$17.08/$17.22/$17.49/$17.68/$17.72/$17.98/$18.24 marks respectively.
- On the other side, a daily close below $16.47 will take the parity down towards key supports at $16.42/$16.28/$16.03 marks respectively.
- Important to note here that 20D, 30D and 55D EMA heads down and confirms the bearish trend in a daily chart. Current upside movement is short term trend correction only.
We prefer to go long on XAG/USD around $16.58 with stop loss at $16.42 and target of $16.82.


