


 FxWirePro: GBP/NZD range to extend until there is game changing news
  FxWirePro: GBP/USD recovers but bears are not done yet again
  Euro Retreats as Geopolitical Tensions Surge: EURUSD Eyes 1.1400 Floor Amid Safe-Haven Demand
  EUR/JPY Bulls Charge: Eyeing 186.00 as Euro Strength Intensifies
  FxWirePro- Major European Indices
  FxWirePro- Major Crypto levels and bias summary
  NZDJPY Bears Take Control: New Zealand Dollar Retreats as 92 Resistance Holds Firm
  FxWirePro: USD/ZAR fibo rejection triggers sizeable pullback
  FxWirePro: AUD/USD downside pressure builds, key support level in focus
  FxWirePro: USD/JPY firms as Trump's address on Gulf war spark fresh concerns
  FxWirePro: EUR/ NZD steadies around 2.0150, retains bid tone
  FxWirePro- Major Crypto levels and bias summary
  Bitcoin Battles Volatility: Institutional Support Eyes USD 64,000 Floor Amid Geopolitical Tensions
  FxWirePro: USD/ZAR sustains gains as uptrend remains strong
  FxWirePro: USD/CAD runs out of steam but maintains bullish outlook


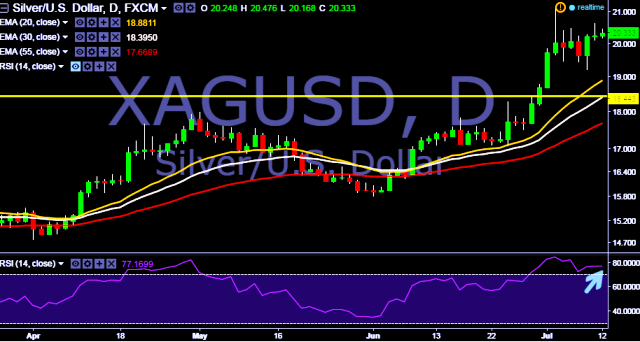
- XAG/USD is currently trading around $20.34 marks.
- It made intraday high at $20.47 and low at $20.16 levels.
- Intraday bias remains bullish till the time pair holds key support at $20.05 marks.
- A daily close above $20.65 tests key resistances at $20.78, $21.09 and $21.46 marks respectively.
- On the other side, a daily close below $20.05 will take the parity down towards key supports at $19.96, $19.88, $19.65, $19.34, $19.12, $19.09 and $18.68 marks respectively.
- Important to note here that in a daily chart, 20D, 30D and 55D EMA heads up and confirms the bullish trend.
We prefer to take long position in XAG/USD around $20.28, stop loss at $20.05 and target $20.47/$20.65/ $20.78 marks.


