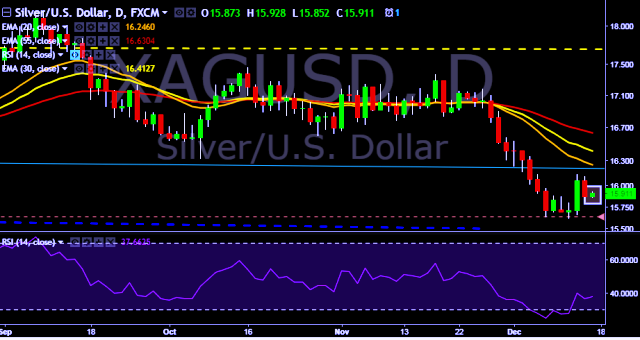
XAG/USD is currently trading around $15.91 marks. It made intraday high at $15.92 and low at $15.85 levels. Intraday bias remains slightly bullish till the time pair holds key support at $15.80 mark. A daily close above …
It made intraday high at $15.92 and low at $15.85 levels.
Intraday bias remains slightly bullish till the time pair holds key support at $15.80 mark.
A daily close above $15.87 will test key resistances at $16.02, $16.12, $16.22, $16.32, $16.40, $16.49 and $16.57 marks respectively.
On the other side, a daily close below $15.87 will take the parity down towards key supports at $15.78, $15.62, $15.44, $15.28 and $15.18 marks respectively.
Important to note here that 20D, 30D and 55D EMA heads down and confirms the bearish trend in a daily chart. Current upside movement is short term trend correction only.
We prefer to take long position in XAG/USD only above $15.92, stop loss $15.80 and target of $16.10/$16.22 mark.