


 China’s AI Manufacturing Boom Masks Weak Consumer Economy, Citi Says
  Goldman Sachs: US Dollar Likely to Stay Strong Despite Oil Price Retreat
  AI Memory Boom Sparks Global Chip Supply Crunch
  Silver Cracks Key 365-Day EMA for First Time Since Feb 2024; Bears Eye $50 on Rallies
  J.P. Morgan Sees Potential Vestas Guidance Upgrade Amid Strong Wind Energy Demand
  World Cup technology: from ref cams to AI analysts, cutting-edge research is changing the game
  SpaceX Stock Gets $175 Target as Analysts See Massive Growth Ahead
  With Iran and the US signing a peace deal, where does that leave Benjamin Netanyahu?
  How Donald Trump has changed the way diplomacy is done
  Morgan Stanley Sees Chinese Auto Market Recovery Gaining Momentum in Late Summer
  Gold's 365-Day EMA Streak Since Oct 2023 Faces Its First Real Test at $3,980 — Break or Bounce to $4,140?


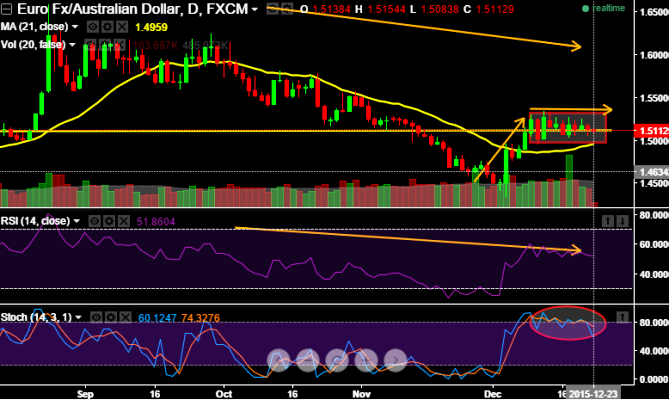
The pair has moved in narrow range (1.50 - 1.5343) after breaking supports at 1.5116 levels.
Leading oscillators on daily showing divergence to the previous short term uptrend and on monthly charts are converging these bearish sentiments.
RSI curve is steeply trending below at 49.9856 and %D line crossover has been maintaining beautifully near 45 levels, (current %D is at around 43.4355 and %K is at 39.7666) but there has been slight divergence on weekly charts.
In our opinion on these technical reasoning creates best swing trading opportunity, it is better to use these rallies and stay calm with earlier ITM long puts and any minor upswings can be utilized OTM put writings.
Most likely scenario: Decline to retest towards 1.5010.
Adverse scenario: Alternatively, it can even test 1.5275.
Overall now the pair is inching towards little upwards slowly, while weekly leading oscillators puzzle by signaling divergence to the dropping prices.

- News

- Economy

- Central Banks
- Investing
- Research
- Roundups
- Digital Currency
- Insights
- Technical Analysis
- Technology
- Business
- Law
- Health
- Nature
- Fintech
- Science
- Topic
- Opinions
- ©Econometrics LLC . All Rights Reserved.
FxWirePro: Swing trading opportunities in EUR/AUD’s sideway trend
Wednesday, December 23, 2015 9:15 AM UTC
Editor's Picks


- Market Data
Most Popular


