


 Geopolitical Easing Fuels AUDJPY Rally Toward 115 — Buy Dips at 113
  FxWirePro: GBP/AUD eases on Geopolitical whipsaw
  Sell the Bounce: NZDJPY Bearish Bias Persists Below 94.20, Eyes 90.50
  FxWirePro: USD/JPY gains above 160 level ahead of BOJ policy meeting
  FxWirePro: USD/ CNY falls towards 6.750, bears keep the advantage
  FxWirePro: USD/CAD steadies around 1.3990 ,retains bid one
  FxWirePro: GBP/USD range-bound as Iran uncertainty keeps traders cautious
  FxWirePro: AUD/ USD strongly bearish despite upside attempts
  BTC’s Bear Bounce: Sell the Rally Near $66K as Bears Target $59K–$52K Breakdown
  FxWirePro: GBP/AUD runs out of steam but maintains bullish outlook
  FxWirePro: GBP/NZD stuck in range but outlook is bullish
  FxWirePro: USD/ZAR edges higher, set to stay on back foot
  Relief Rally Extends to 112.75, but AUDJPY EMA Structure Favors Selling
  FxWirePro- Major Pair levels and bias summary


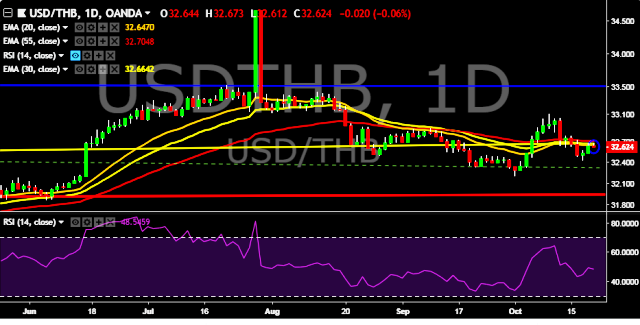
- USD/THB is currently trading around 32.61 marks.
- It made intraday high at 32.67 and low at 32.61 marks.
- Intraday bias remains neutral for the moment.
- On the top side, key resistances are seen at 32.65, 32.90, 33.05, 33.20, 33.37, 33.52, 33.78 and 33.96 marks respectively.
- Alternatively, a daily close below 32.65 will drag the parity down towards key supports around 32.42, 32.27, 32.18, 32.02 and 31.85 marks respectively.
- Important to note here that 20D, 30D and 55D EMA heads down and confirms the bearish trend in a daily chart.
Positioning is inconclusive at this point, with prices offering no clear cut signal to initiate a long or short trade. We will continue to remain on sidelines for the time being.


