


 BTC’s Bear Bounce: Sell the Rally Near $66K as Bears Target $59K–$52K Breakdown
  Sell the Bounce: NZDJPY Bearish Bias Persists Below 94.20, Eyes 90.50
  FxWirePro- Major Pair levels and bias summary
  FxWirePro: EUR/ NZD uptrend loses steam, remains on bullish path
  FxWirePro: GBP/AUD runs out of steam but maintains bullish outlook
  FxWirePro: AUD/ USD strongly bearish despite upside attempts
  FxWirePro: GBP/AUD eases on Geopolitical whipsaw
  Geopolitical Easing Fuels AUDJPY Rally Toward 115 — Buy Dips at 113
  Peace Dividend Powers NZDJPY Past 93.50 — Bulls Set Sights on 96.15 Target
  FxWirePro- Woodies pivot (Major)
  GBPJPY Coil Tightens: Is a Bullish Break Above 215.60 Imminent?
  FxWirePro: GBP/NZD stuck in range but outlook is bullish


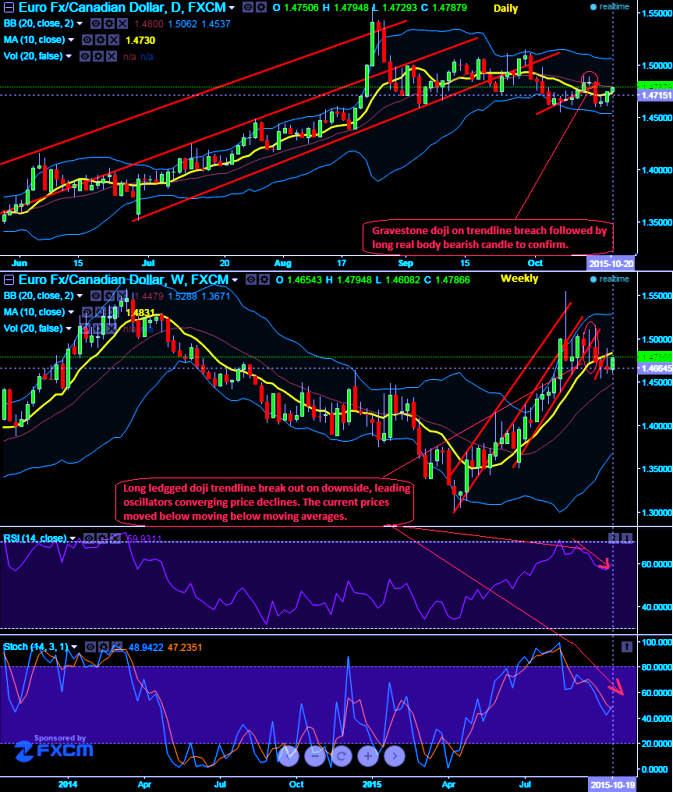
On both weekly and daily charts of EURCAD, we spot out Doji pattern candles formed to highlight a caution for bulls. As you can observe Doji on weekly charts has occurred exactly on a trendline breach at around 1.4909 levels which is to be considered as a caution of previous of upswings.
On daily chart, again a sharp Doji is formed at 1.4838 levels followed by a long real body bearish candle has formed to fall below moving average curve.
In addition to that leading oscillators are showing convergence with the price dips on weekly chart. RSI (14) looks healthily converging with every price declines at 59.9291; it has been showing the same indication right from overbought territory. So, RSI signifies the prevailing down streaks may sustain for some slumps.
While another leading oscillator (slow stochastic) hints us the overbought heaviness through %D crossover above 80 levels which overbought zone though the bulls don't seem to lose rallies built by healthy volumes. Hence, we could see our next targets at 1.4525 levels on south.

- News

- Economy

- Central Banks
- Investing
- Research
- Roundups
- Digital Currency
- Insights
- Technical Analysis
- Technology
- Business
- Law
- Health
- Nature
- Fintech
- Science
- Topic
- Opinions
- ©Econometrics LLC . All Rights Reserved.
FxWirePro: Trendline breach, bearish candles and oscillators signal EUR/CAD further slumps
Tuesday, October 20, 2015 8:44 AM UTC
Editor's Picks


- Market Data
Most Popular


