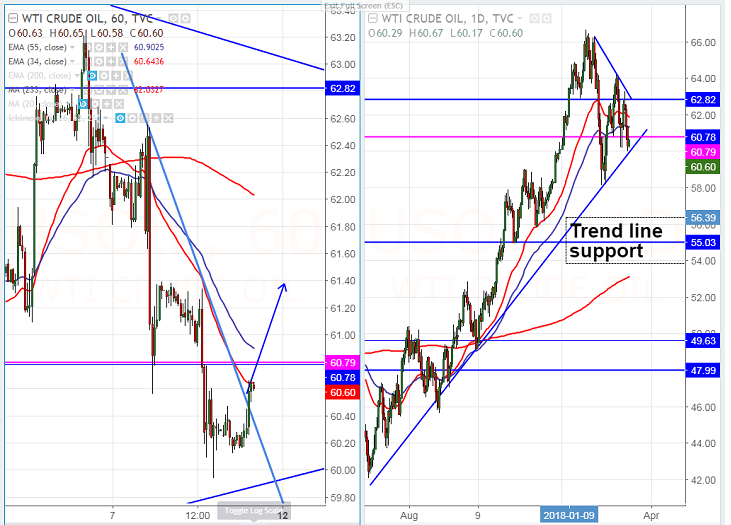
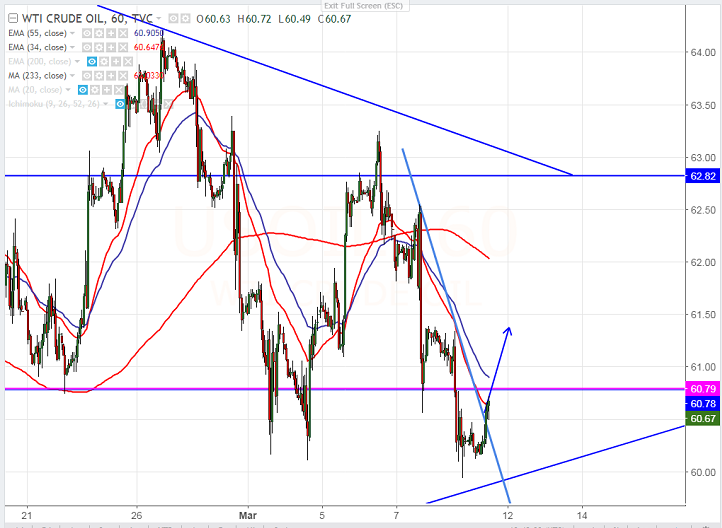
US oil shown a minor recovery after hitting low of $59.94. The commodity has taken support near trend line and shown a minor jump and is currently trading around $60.65. Oil prices was trading weak for the past two days …
US oil shown a minor recovery after hitting low of $59.94. The commodity has taken support near trend line and shown a minor jump and is currently trading around $60.65.
Oil prices was trading weak for the past two days due to higher dollar and increase in crude inventory. EIA shows that US crude inventory rose by 2.4 MMbbls compared to forecast of 2.7MMbbls.
US crude production increased 86000 b/d last week to 10.369 million b/d, a record high. This will affect the major upside in oil prices.
On the lower side, near term major support is around $59.80 (trend line support) and any break below will drag the pair down till $59.40/$59/$58. Short term bullish invalidation only below $58.
The near term intraday resistance is around $60.92 (55- H EMA and 23.6% fibo) and any break above will take the commodity till $61.45/61.84/$62.50.
It is good to buy on dips around $60.45-50 with SL around $59.95 for the TP of $61.45/$62.50.