


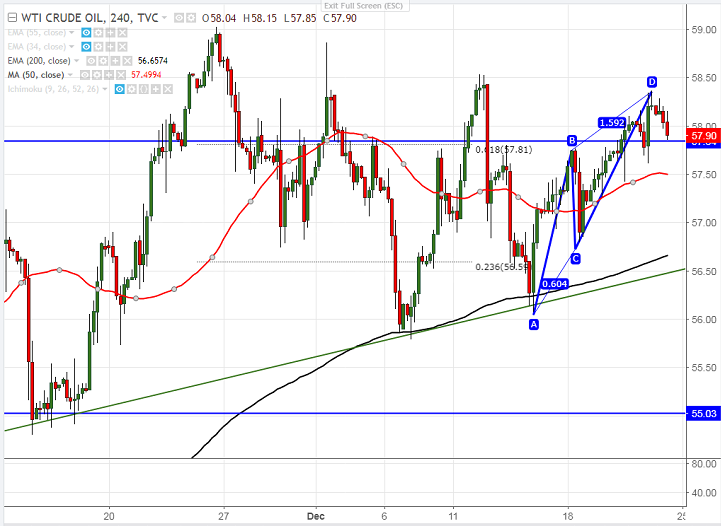
Harmonic Pattern- Bearish AB=CD Pattern
- US oil has shown a minor dip after hitting high of $58.36. The main reason for minor dip is that Britain’s Forties pipeline in the North Sea is expected to start its operation on Jan. The commodity declined slightly $0.50. It is currently trading around $57.80.
- US crude inventory came slightly better than expected on Wed. US crude stocks fell by 6.5 million compared to forecast of 3.6 million.
- Technically, the pair is facing strong resistance at $59.02 and nay minor bullishness can be seen only above that level. Any break above will take the commodity till $60/$61.80.
- On the lower side, near term support is around $57 and any violation below will drag the commodity till $55.79/$55.
It is good to sell on rallies around $58.30-35 with SL around $59.02 for the TP of $57/$56.


