


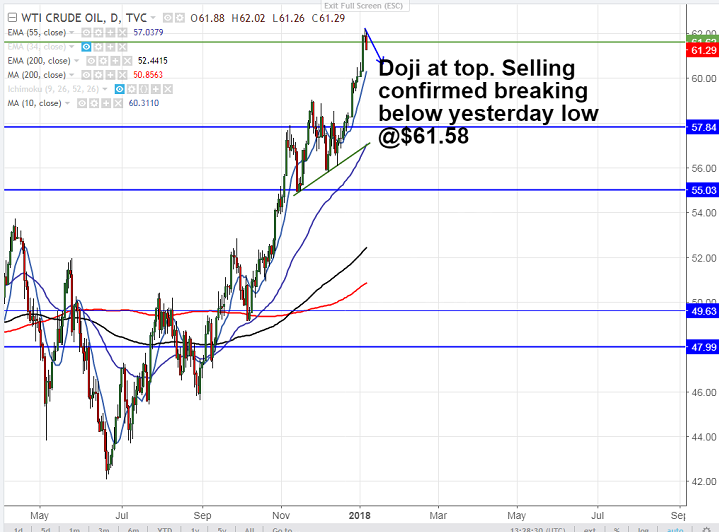
- Candle stick pattern formed – Doji.
- USOIL jumped almost $2 in this week and is consolidating after hitting high of $62.18. Oil prices dipped till $61.27 at the time of writing. It is currently trading around $61.36.
- The main reason for jump in crude oil price is due to protest in Iran. The protest in Iran started in eastern Iranian city of Mashhad and has spread to 5o cities including Tehran.
- On the lower side, near term support is around $61.10 (5- day MA) and any break below will drag the commodity to next level till $60.86/$60.31/$59.85 (38.2% fibo).
- The near term major resistance is around $62.20 and any break above will take the commodity till $63/$63.48 (161.8% retracement).
It is good to sell on rallies around $61.55-$61.60 with SL around $62.20 for the TP of $60.40/$59.85.


