


 FxWirePro:NZD/USD remains vulnerable as Trump's latest deadline leaves investors on edge
  FxWirePro: USD/JPY firms as Trump's address on Gulf war spark fresh concerns
  Bitcoin Resilience: BTC Reclaims USD 69,000 as Geopolitical Tensions Ease
  Pound Under Pressure as Yen Stabilizes: GBPJPY Bears Target 208 as Key EMAs Hold Resistance
  FxWirePro: GBP/NZD remains buoyant, looks to extend gains
  FxWirePro: USD/ZAR sustains gains as uptrend remains strong
  Aussie Retreats Against the Yen: AUDJPY Bears Target 108 as 110 Resistance Holds Firm
  NZDJPY Bears Take Control: New Zealand Dollar Retreats as 92 Resistance Holds Firm
  FxWirePro- Major European Indices
  FxWirePro: EUR/ NZD consolidating around 2.0180 room for further gains
  Ethereum Retreats Toward USD 2,000: Technicals Signal Caution as ETH Mimics Bitcoin’s Pullback
  Aussie Ascent: AUDJPY Reclaims 110.00 as Bullish Momentum Ignites
  FxWirePro- Major Pair levels and bias summary
  FxWirePro- Major Pair levels and bias summary


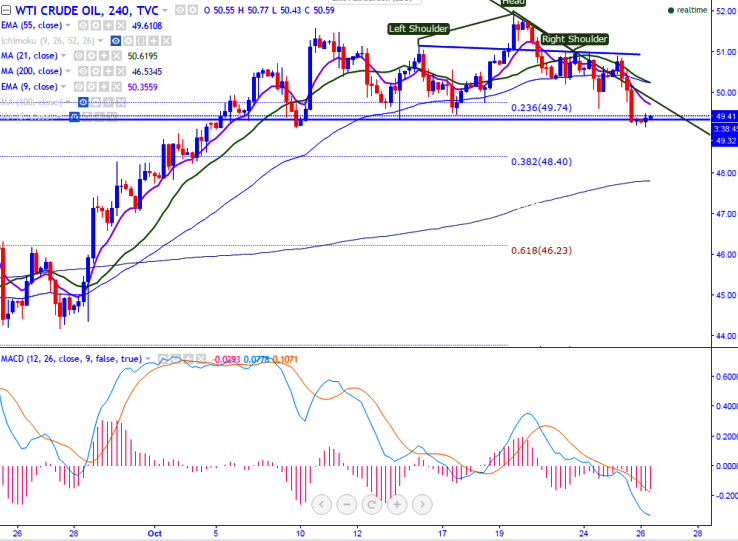
- Pattern formed – Head and Shoulder pattern
- Major resistance - $50.49 (200- HMA).
- US Oil has formed head shoulder pattern on the hourly chart .The commodity has broken major neckline support at $49.34 and declined till $49.14 at the time of writing.
- On the lower side, any break below $49.34 will drag the commodity down till $48.40 (38.2% retracement of $42.72 and $51.91)/$47.80 (200- 4 H MA).
- The minor resistance is around $49.52 (21- H MA) and any break above targets $50/$50.49 (200- H MA).
It is good to sell on rallies around $49.50-$49.55 with SL around $50 for the TP of $48.40/$47.80


