


 GBPJPY Coil Tightens: Is a Bullish Break Above 215.60 Imminent?
  Sell the Bounce: NZDJPY Bearish Bias Persists Below 94.20, Eyes 90.50
  FxWirePro: USD/ CNY falls towards 6.750, bears keep the advantage
  Relief Rally Extends to 112.75, but AUDJPY EMA Structure Favors Selling
  FxWirePro: AUD/USD climbs as US-Iran peace deal sparks risk rally
  FxWirePro- Woodies pivot (Major)
  FxWirePro: USD/JPY gains above 160 level ahead of BOJ policy meeting
  Ethereum Cracks Under $1,700: Sell the Rally Near $1,750 as Bears Eye $1,380–$1,200
  FxWirePro: GBP/NZD stuck in range but outlook is bullish
  FxWirePro- Major Crypto levels and bias summary
  FxWirePro- Major Pair levels and bias summary
  FxWirePro: GBP/USD range-bound as Iran uncertainty keeps traders cautious
  FxWirePro: USD/CAD steadies around 1.3990 ,retains bid one
  BTC’s Bear Bounce: Sell the Rally Near $66K as Bears Target $59K–$52K Breakdown


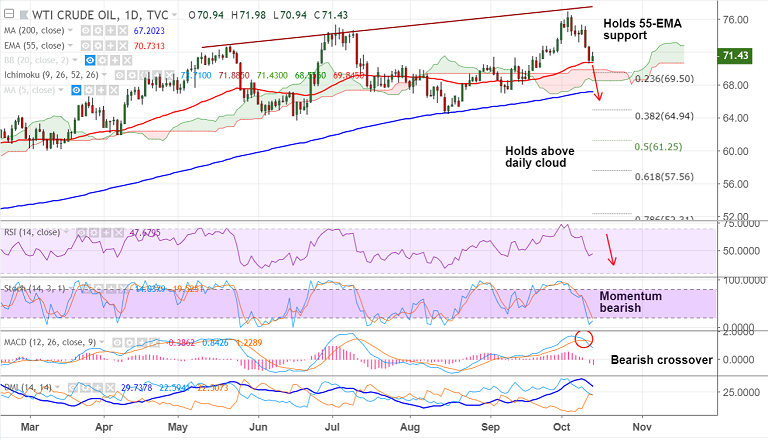
US Oil chart on Trading View used for analysis
- US oil has pauses decline and is trading slightly higher on the day.
- WTI has retraced above 71 mark and is currently trading at 71.34.
- Price finds strong support at 55-EMA at 70.72, break below will see further weakness.
- Next major support below 55-EMA lies at daily cloud 69.85, breach there to see further downside. Dip till 200-DMA likely.
- On the flip side, failure to break below 55-EMA could see retrace.
Support levels - 71, 70.73 (55-EMA), 70
Resistance levels - 72.35 (21-EMA), 72.78 (5-DMA)
Recommendation: Watch out for break below 55-EMA to go short, SL: 72.35, TP: 69.20/ 69/ 67.98
For details on FxWirePro's Currency Strength Index, visit http://www.fxwirepro.com/currencyindex.


