


 US Magnificent 7 Stocks Trend Score: Amazon & Microsoft Hit Extreme Bullish (+100) as Meta Drops to -100 — Key Resistance & Support Watchlist
  Major European Indices Score Extremely Bullish: DAX Eyes 26000, CAC Targets 8600, FTSE100 at 11000 – Key Levels to Watch
  FxWirePro- Major Pair levels and bias summary
  FxWirePro: EUR/ AUD dips below 1.6400 level, focus on near term support
  Major FX Action Bias & US Market Sentiment: NZD/USD (Extremely Bullish) & AUD/USD (Bullish) Watchlist
  FxWirePro:USD/JPY climbs back above 160.00 after BOJ rate decision
  Nikkei Surges Past 65,000 on Suspected Yen Weakness: Tech Giants Like Advantest and NEC Lead Explosive Gains
  FxWirePro: GBP/NZD remains weak, eyes 38.2%fib support
  FxWirePro: USD/CNY dips to hit three year low,scope for further downside
  NZDJPY Retreats on Yen Strength – Bearish Setup Targets 90 After Hitting 92.75 Low
  FxWirePro- Major Crypto levels and bias summary
  AUD/JPY Slips Below 112 as BOJ Intervention Sparks Bearish Momentum: Sell the Rallies
  FxWirePro- Woodies pivot (Major)
  FxWirePro: GBP/AUD drifts lower after BOE rate decision
  FxWirePro: GBP/AUD bears maintain upper hand


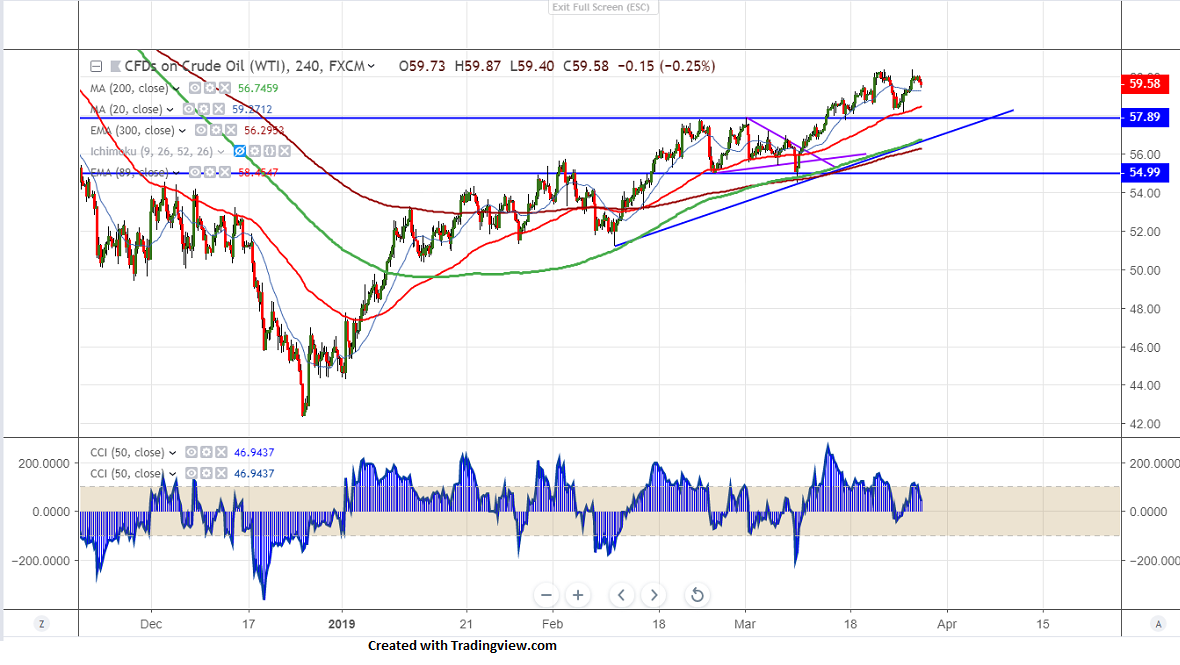
Chart pattern- Double top
Major resistance - $60.35
US oil jumped more than $2 from the low of $58.16 on Mar 25th 2019 and hits fresh four month high on account of declining crude oil inventories and OPEC supply cut. But global growth concerns is major factor which is preventing further upside. The commodity hits intraday low of $59.40 and is currently trading around $59.51.
On the lower side, near term support is around $59.26 (20- 4H MA) and any break below will take the commodity down till $58.96 (61.8% fib)/$58.42 (89- 4H EMA)/$58.16.
The near term major resistance is around $60.40 and violation above will take the US oil to next level till $61/$61.60/$61.83.
It is good to sell on rallies around 59.75-80 with SL around $60.35 for the TP of $58.20.


