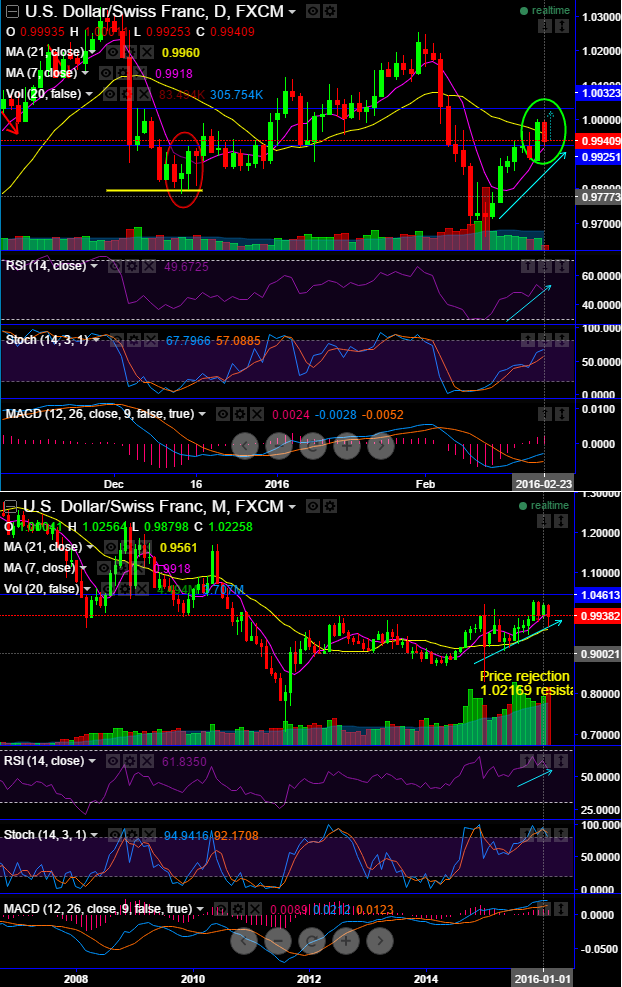
Bearish pulling back despite the formation of bullish engulfing pattern at 0.9993, prior to which gravestone doji at 0.9925 appeared to reduce the bullish momentum. For today, it has taken a support at 0.9925 but still lingering with an intraday loses.
Leading oscillators pose indecision, the RSI (14) on daily chart has begun showing divergence to the previous price rallies.
While stochastic curve evidences %K line crossover at around 60s which is a contradictory to RSI, provided bulls capitalize on the today's support it is likely to gain momentum bak again in the buying interest.
It is most likely event that 7DMA crossing over 21DMA which is a an additional signal for bull trend continuation.
Overall for short term traders it would be like a see-saw moment, the major trend has been baffling however, dominated by the short term bulls with clear volume confirmation, we can only see near resistance at 1.0035 levels, so, if it holds above mentioned support levels (0.9925) and bounce back tomorrow decisively then 1.0035 and even 1.0469 is possible in medium terms. Aggressive bulls can utilize the 0.9925 (support) or even at current levels to initiate longs for targets of 100 pips from here onwards but keep a strict stop loss of 20-25 pips below this support.