


 FxWirePro: EUR/AUD under pressure as key support gives way
  FxWirePro: GBP/NZD down trend loses steam, remains on bearish path
  FxWirePro- Woodies Pivot(Major)
  FxWirePro: EUR/AUD downtrend loses steam but outlook still bearish
  NZDJPY Bulls Charge Toward 95.00: Safe-Haven Exodus Drives Kiwi Rally
  FxWirePro: AUD/USD retreats slightly but trend is still bullish
  FxWirePro: USD/ZAR edges lower ,investors remain on edge
  Ethereum Consolidates: Bullish Technicals Point to a Potential $3,000 Breakout
  FxWirePro- Woodies Pivot(Major)
  Bitcoin’s Volatile Reset: ETFs Rebound as Bulls Eye USD 80,000 Milestone
  FxWirePro: USD/ZAR recovers slightly but trend is still bearish
  FxWirePro- Major European Indices
  FxWirePro: EUR/CAD gains ground on prospects of resumed energy flows
  FxWirePro: USD/CNY neutral in the near-term, scope for downward resumption
  FxWirePro: GBP/AUD positions for another drop, eyes 1.8900level
  FxWirePro:NZD/USD uptrend loses momentum but bullish setup remains


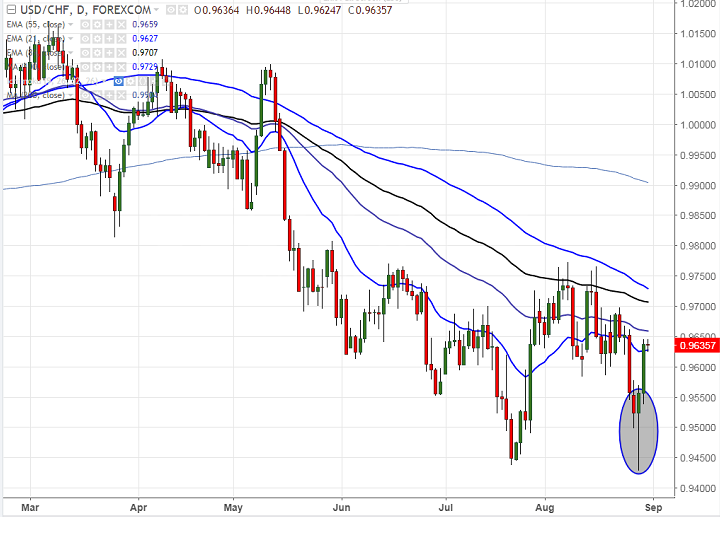
- USD/CHF has shown a major recovery from the bottom of 0.94290 on Aug 29th 2017 level. The pair has formed hammer candle stick pattern in the daily chart on Aug 29th 2017 and closed well above the high of 0.95697 (Aug 29th high) yesterday. This confirms minor bullishness and a jump till 0.9700/0.97700 is likely.
- The jump in USD is mainly due to better than expected US economic data. US economy has added 327k private sector jobs in Aug compared to forecast of 185K. The pair jumped sharply from the low of 0.95723 made before data release till 0.9645. The near term resistance is around 0.9645 (61.8% retracement of 0.97730 and 0.94285).
- On the lower side, 0.9570 will be acting as major intraday support and any break below will drag the pair down till 0.9530/0.9500. Overall bearish continuation only below 0.94285.
It is good to buy on dips around 0.96250-0.96300 with SL around 0.9570 for the TP of 0.9700/0.9770.


