


 Relief Rally Extends to 112.75, but AUDJPY EMA Structure Favors Selling
  FxWirePro: EUR/ NZD uptrend loses steam, remains on bullish path
  FxWirePro- Major Crypto levels and bias summary
  FxWirePro- Woodies pivot (Major)
  Geopolitical Easing Fuels AUDJPY Rally Toward 115 — Buy Dips at 113
  FxWirePro: GBP/USD range-bound as Iran uncertainty keeps traders cautious
  FxWirePro- Major Pair levels and bias summary
  FxWirePro: USD/ZAR edges higher, set to stay on back foot
  FxWirePro: GBP/NZD stuck in range but outlook is bullish
  Sell the Bounce: NZDJPY Bearish Bias Persists Below 94.20, Eyes 90.50
  FxWirePro: USD/ CNY falls towards 6.750, bears keep the advantage
  Ethereum Cracks Under $1,700: Sell the Rally Near $1,750 as Bears Eye $1,380–$1,200
  Peace Dividend Powers NZDJPY Past 93.50 — Bulls Set Sights on 96.15 Target
  FxWirePro: NZD/USD jumps after US and Iran agree preliminary deal


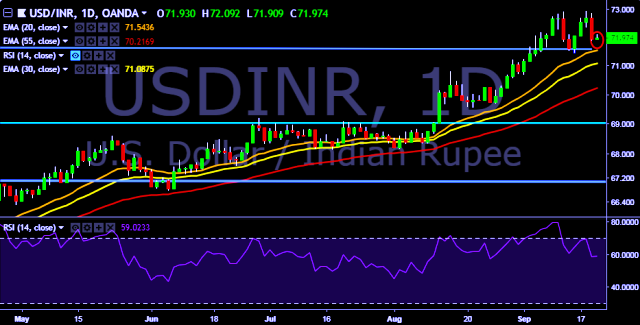
- USD/INR is currently trading around 71.94 marks.
- It made intraday high at 72.09 and low at 71.90 marks.
- Intraday bias remains neutral for the moment.
- Key resistances are seen at 72.24, 72.68, 72.85, 73.02, 73.24 and 73.66 marks respectively.
- On the other side, initial supports are seen at 71.88, 71.68, 71.47, 71.33, 71.13, 70.63, 70.47, 70.22 and 69.94 marks respectively
- Important to note here that 20D, 30D and 55D EMA heads up and confirms the bullish trend in a daily chart. Current downside movement is short term trend correction only.
We prefer to take short position on USD/INR only below 71.88, stop loss at 72.24 and target of 71.68/71.50.


