
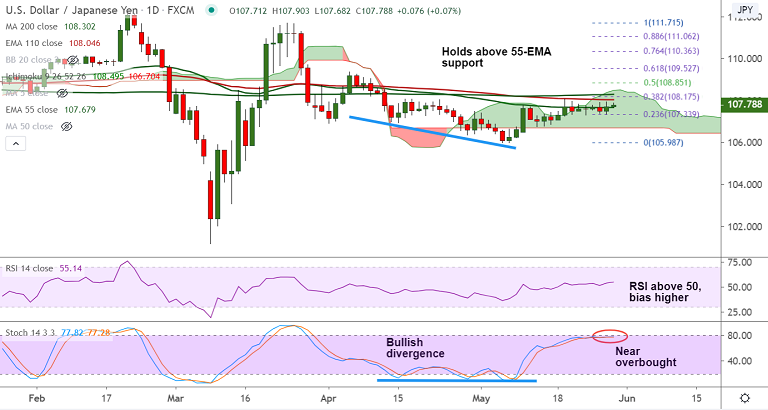
USD/JPY chart - Trading View
Technical Analysis: Bias Slightly Bullish
GMMA Indicator
- Major and minor trend are neutral
- GMMA provides no clear directional bias
Ichimoku Analysis
- Price action is within daily cloud
- Bullish Tenkan Sen crossover on Kijun Sen supports upside bias
- Breakout above or below cloud will provide clear direction
Oscillators
- Oscillators are bullishly aligned
- RSI is above 50 and bias higher
- Stochastics show bullish momentum. Are near overbought levels, but no signs of reversal
Bollinger Bands
- Bollinger bands are widening on the daily charts
- Rising volatility with bullish momentum could carry the pair higher
Major Support Levels: 107.67 (55-EMA), 107.42 (21-EMA), 106.70 (Cloud base)
Major Resistance Levels: 107.82 (50-DMA), 108.04 (110-EMA), 108.30 (200-DMA)
Summary: The pair is extending sideways grind for the past two weeks. Price action has edged above 55-EMA and minor signs of upside seen. Break above 110-EMA will see test of 200-DMA. Decisive break above 200-DMA required for upside continuation.


