


 FxWirePro: GBP/USD downtrend loses steam but outlook still bearish
  FxWirePro: AUD/USD uptrend loses steam, remains on bearish path
  AUDJPY Extends Four-Day Rally on Yen Weakness: Bullish Dip-Buy Eyes 117-118
  FxWirePro: USD/ZAR surges as rand slumps after SARB rate hold surprise
  FxWirePro- Major Crypto levels and bias summary
  FxWirePro- Major Crypto levels and bias summary
  BTC, ETH, SOL, XRP, and BNB: Major Crypto Pairs Stay Neutral
  FxWirePro- Major Pair levels and bias summary
  FxWirePro: GBP/USD slips as middle east tensions and oil surge pressure pound
  FxWirePro: USD/CAD positions for another climb, eyes 1.4150 level
  FxWirePro: USD/CNY edges higher but bulls lack punch
  FxWirePro: GBP/NZD downside pressure builds, key support levels in focus
  FxWirePro: GBP/AUD bears maintain upper hand
  FxWirePro: EUR/NZD firms after ECB holds rates steady at 2.25%
  FxWirePro: USD/ZAR retreats slightly but bias is bullish


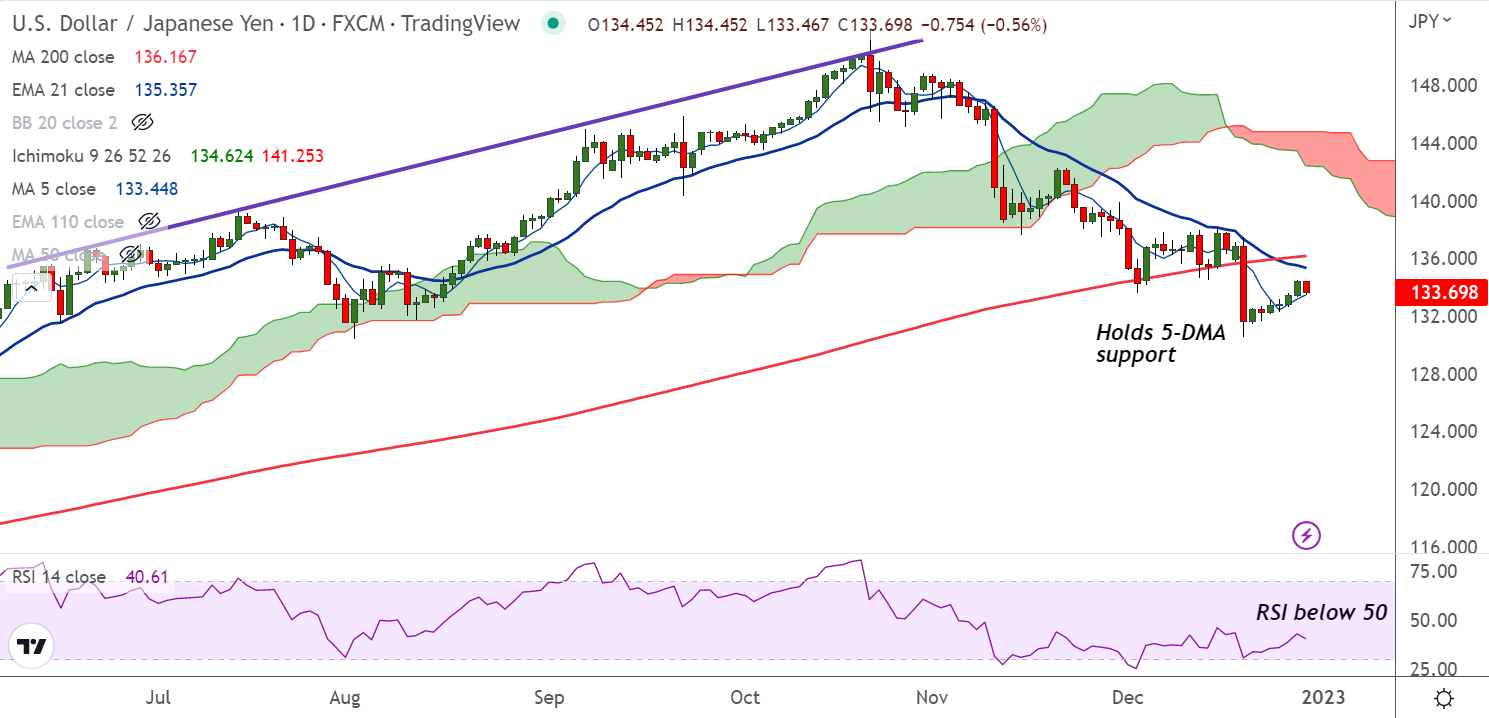
Chart - Courtesy Trading View
Spot Analysis:
USD/JPY was trading 0.48% lower on the day at 133.81 at around 07:50 GMT.
Previous Week's High/ Low: 137.47/ 130.56
Previous Session's High/ Low: 134.50/ 133.34
Fundamental Overview:
US dollar under pressure as yields retreat despite China Covid woes.
Risk-off flows dominate and boost the safe-haven demand for the Japanese Yen amid the end-of-the-year thin market conditions.
Fresh Covid-linked prerequisites for Chinese travelers and doubts over Beijing’s reporting of data along with a jump in the virus numbers weigh on sentiment.
On the data front, US Pending Home Sales for November dropped to -37.8% YoY versus -36.7% expected and -37.0% previous readings.
The Richmond Fed Manufacturing Index for December improved to 1.0 versus -4.0 anticipated and -9.0 prior.
Further, BoJ conducted unplanned bond-buying twice on Thursday. Yen little affected by the BoJ’s operations.
The BoJ offered to buy unlimited amounts of two- and five-year notes at a fixed yield and also JPY 600 billion yen of one-to-10-year bonds on top of a daily offer to buy 10-year debt at 0.5%
Technical Analysis:
- USD/JPY snaps a 4-day bullish streak
- GMMA indicator shows major trend is bearish, while minor trend is neutral
- Price action is holding above 5-DMA which is biased higher
- MACD confirms bullish crossover on signal line
Major Support and Resistance Levels:
Support - 133.44 (5-DMA), Resistance - 135.35 (21-EMA)
Summary: USD/JPY trades with a neutral bias. Decisive break above 200-DMA will change near-term dynamics.


