


 Peace Dividend Powers NZDJPY Past 93.50 — Bulls Set Sights on 96.15 Target
  FxWirePro- Woodies pivot (Major)
  FxWirePro: EUR/ NZD uptrend loses steam, remains on bullish path
  FxWirePro- Woodies pivot (Major)
  FxWirePro: GBP/USD range-bound as Iran uncertainty keeps traders cautious
  GBPJPY Coil Tightens: Is a Bullish Break Above 215.60 Imminent?
  Indonesia Passes New Central Bank Law, Raising Investor Concerns Over Policy Independence
  Jerome Powell Warns Against Politicizing the Federal Reserve, Defends Democratic Institutions
  Kevin Warsh Faces Early Fed Test as Inflation Risks Challenge Rate-Cut Expectations
  FxWirePro: USD/CAD steadies around 1.3990 ,retains bid one
  Geopolitical Easing Fuels AUDJPY Rally Toward 115 — Buy Dips at 113
  BTC’s Bear Bounce: Sell the Rally Near $66K as Bears Target $59K–$52K Breakdown
  Fed Chair Kevin Warsh Signals Policy Overhaul as Hawkish Rate Outlook Rattles Markets
  South Korea Signals Possible Interest Rate Hike as Inflation Remains Elevated
  China Keeps Loan Prime Rates Unchanged for 13th Straight Month as Policymakers Prioritize Credit Demand Recovery


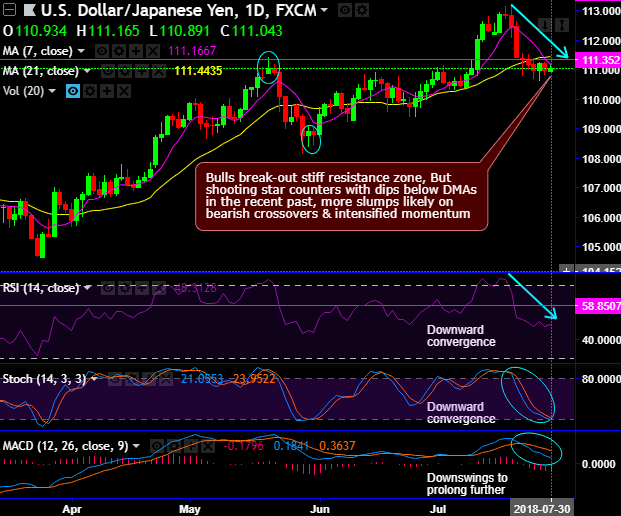
- USDJPY has formed shooting star patterns at 112.835 (on the daily chart) and 111.422 levels (on weekly plotting) amid today's mild rallies as market nudges trade war tormentor but seems to have considered BoJ and Fed’s monetary policy season again this week.
- The current trend is wedged between 111.352 and 110.769 levels after the formation of hammer pattern at 111.220 levels on the contrary to the above bearish patterns (refer daily charts).
- On intermediate trend, bulls are retracing from the March 2018 bottom of 104.629 levels to the November 2017 highs, will foresee further upside traction upto next 61.8% Fibonacci levels (refer weekly plotting). Price action on this timeframe has bounced back into the long lasting range bounded trend. But the pair has failed to sustain its bullish momentum and slid back below the 50% Fibonacci level. As a result, you can trace out shooting star formation at that juncture.
- The major trend has been bearish, but 7-EMA likely to act as the major support at 110.667 levels. We see bullish invalidation on retrace below.
- Both leading oscillators (RSI and fast stochastic curves) are signalling intensified bearish momentum on both time frames and trend confirmation (both lagging indicators, DMA & MACD show bearish crossovers) on daily plotting. We could foresee the scope for further upside traction only if it bounces above DMAs.
- While Yen seems to be gaining its traction via safe-haven sentiments.
Key Support Levels: 110.667, if it breaks this level then you could see dips upto 110.260 areas that are regarded as next strong support zones.
Trade tips: On every dip, it is wise to buy tunnel options spreads, with upper strikes at 111.352 and lower strikes at 110.667.
Alternatively, on hedging grounds, at spot reference: 111.073 levels, we advocate shorting futures contracts of mid-month tenors as the underlying spot FX likely to target southwards 109 levels in the medium-run.
Writers in a futures contract are expected to maintain margins in order to open and maintain a short futures position.
FxWirePro Currency Strength Index: FxWirePro's Hourly USD Spot Index was at -27 (which is bearish), while Hourly JPY Spot Index was at 58 (bullish) at 08:21 GMT.
These figures are also conducive to the above-stated options strategy.
For more details on FxWirePro's Currency Strength Index, visit below web-link:


