


 FxWirePro- Woodies pivot (Major)
  Crypto Action Bias: ETHUSD Stands Out as the Bullish Pair to Watch
  FxWirePro: GBP/AUD gains some upside momentum but still bearish
  NZDJPY Pullback: Sell Rallies Toward 93.30 as Yen Weakness Eases
  JPY Action Bias: USDJPY Emerges as the Clear Bullish Pair to Watch Amid Mixed Crosses
  JPY Pairs Action Bias: EURJPY Leads as Bullish Standout Amid Mixed Momentum
  FxWirePro: EUR/AUD outlook weaker on renewed downside pressure
  FxWirePro: GBP/USD edges higher as traders await BoE guidance and UK fiscal clarity
  FxWirePro- Major Pair levels and bias summary
  NZD/JPY Flatlines Near 94.60: Will Key Support Reignite the Uptrend?
  FxWirePro: AUD/USD falls after softer-than-expected Australian Q2 CPI
  FxWirePro: AUD/USD dips after RBA Governor speech
  FxWirePro: USD/CAD runs out of steam but maintains bullish outlook
  EUR/USD Bounces from Monthly Low, But Bearish Pressure Remains
  AUDJPY Weakness Deepens: Sell Rallies Toward 112 as Aussie Dollar Falters


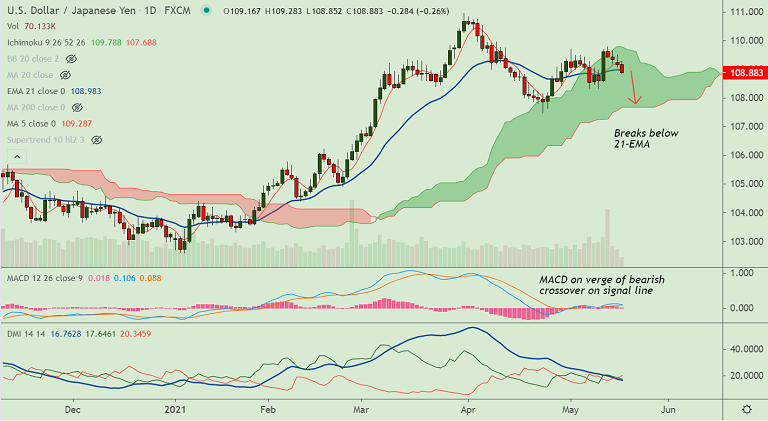
USD/JPY chart - Trading View
USD/JPY was extending downside for the 4th consecutive session, breaks below 21-EMA.
The major was trading 0.23% lower on the day at 108.92, upside remains capped below 5-DMA.
The US dollar remained depressed amid expectations that the Fed will keep rates low for a longer period.
Further, the US dollar index (DXY) remains depressed below 90 and the 10-year Treasury yield gains 1.5 basis points (bps) to 1.65% at the time of writing.
Technical indicators are turning bearish. RSI has slipped below 50 mark. Stochs are showing a rollover from overbought levels.
MACD is on verge of bearish crossover on signal line. Price action has slipped below 200H MA.
GMMA indicator shows bearish shift on the intraday charts. However, major trend on the daily charts remains bullish.
Clarity over reflation and the Fed’s next moves to provide fresh impulse. Focus remains on Wednesday’s Federal Open Market Committee (FOMC) minutes for cues.
20-DMA is offering immediate support at 108.82. Break below will see dip till 108.60 (trendline) ahead of 55-EMA at 108.43.


