


 FxWirePro:USD/JPY climbs back above 160.00 after BOJ rate decision
  Mexico's Undervalued Equity Market Offers Long-Term Investment Potential
  U.S. Treasury Yields Expected to Decline Amid Cooling Economic Pressures
  FxWirePro- Major Crypto levels and bias summary
  Major European Indices Score Extremely Bullish: DAX Eyes 26000, CAC Targets 8600, FTSE100 at 11000 – Key Levels to Watch
  Moldova Criticizes Russia Amid Transdniestria Energy Crisis
  FxWirePro: USD/CAD slips after Fed holds rates steady
  U.S. Stocks vs. Bonds: Are Diverging Valuations Signaling a Shift?
  U.S. Banks Report Strong Q4 Profits Amid Investment Banking Surge
  Nikkei Surges Past 65,000 on Suspected Yen Weakness: Tech Giants Like Advantest and NEC Lead Explosive Gains
  Geopolitical Shocks That Could Reshape Financial Markets in 2025
  Oil Prices Dip Slightly Amid Focus on Russian Sanctions and U.S. Inflation Data
  Major FX Action Bias & US Market Sentiment: NZD/USD (Extremely Bullish) & AUD/USD (Bullish) Watchlist
  Bank of America Posts Strong Q4 2024 Results, Shares Rise
  Stock Futures Dip as Investors Await Key Payrolls Data
  FxWirePro: GBP/AUD gains above 1.9200 level , upside pressure builds
  UBS Predicts Potential Fed Rate Cut Amid Strong US Economic Data


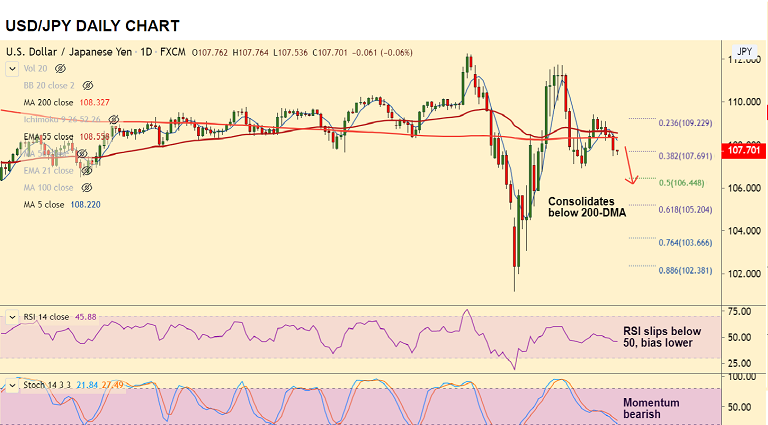
USD/JPY chart - Trading View
USD/JPY was trading 0.07% lower on the day at 06:25 GMT, after closing 0.55% lower in the previous session.
The major was consolidating break below 200-DMA, extending bearish run for the 4th straight session.
GMMA indicator shows major trend in the pair is neutral, while minor trend is turning bearish.
Stochs and RSI also support weakness. Price action has fallen below 200H MA. Further downside likely.
Market sentiment will likely continue to be the key driver. Retail sales and industrial production reports due Wednesday will be watched for further impetus.
Support levels - 106.92 (Apr 1st low), 106.44 (50% Fib)
Resistance levels - 1008.22 (5-DMA), 108.32 (200 DMA)


