


 FxWirePro :USD/JPY eases slightly, remains on bullish path
  FxWirePro- Major Pair levels and bias summary
  FxWirePro: USD/CNY dips as yuan firms on improving risk appetite
  AUDJPY Action Bias: Bullish Dip-Buy Setup Despite Flat Neutral Bias
  FxWirePro: GBP/AUD under pressure as pound continues to weaken
  FxWirePro- Major Pair levels and bias summary
  FxWirePro- Woodies pivot (Major)
  FxWirePro: NZD/USD gains as U.S.-Iran peace hopes boost risk sentiment
  FxWirePro: USD/ZAR retreats slightly but bias is bullish
  FxWirePro: EUR/NZD downside pressure builds, key support level in focus
  FxWirePro: GBP/USD downtrend loses steam but outlook still bearish
  FxWirePro- Major Crypto levels and bias summary
  FxWirePro- Major Crypto levels and bias summary
  FxWirePro: USD/ZAR uptrend loses steam, remains on bullish path
  JPY Action Bias: Bullish Pairs to Watch Out For


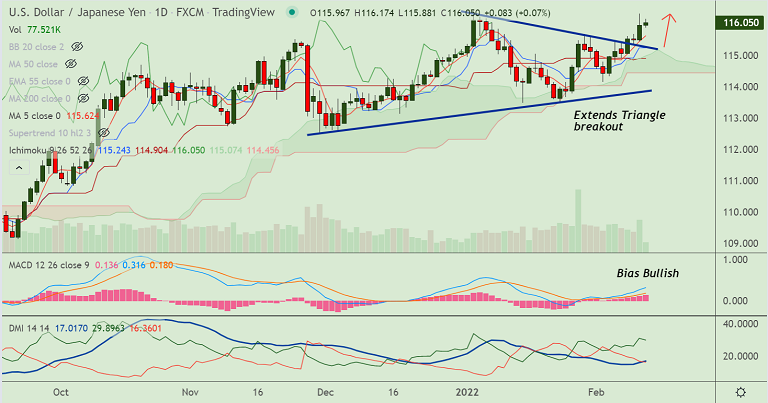
Chart - Courtesy Trading View
Spot Analysis:
USD/JPY was trading largely muted on the day at 116.02, after closing 0.40% higher in the previous session
Previous Week's High/ Low: 115.59/ 114.14
Previous Session's High/ Low: 116.33/ 115.45
Fundamental Overview:
Red-hot U.S. inflation data and hawkish Fed comments fueled bets on aggressive U.S. interest rates hikes, boosting the US dollar.
Data on Thursday showed U.S consumer prices surged 7.5% in Jan on a year-over-year basis, beating estimates of 7.3% and marking the biggest annual increase in inflation in 40 years.
Further, St. Louis Federal Reserve Bank President James Bullard said the data had made him "dramatically" more hawkish.
Technical Analysis:
- USD/JPY is extending break above 'Symmetric Triangle' top
- Bearish RSI divergence on the weekly charts keeps scope for downside
- Momentum is still bullish, MACD supports bullishness, ADX favours gains
- GMMA indicator shows major and minor trend are strongly bullish
Major Support and Resistance Levels:
Support - 115.62 (5-DMA), Resistance - 116.66 (88.6% Fib)
Summary: USD/JPY trades with a bullish bias. Scope for test of 88.6% Fib at 116.66.


