


 FxWirePro- Woodies pivot (Major)
  FxWirePro: USD/CAD slips after Fed holds rates steady
  Buy the Dips on EUR/JPY: Bullish Structure Points to 188 Target Ahead of Fed
  FxWirePro: GBP/AUD gains above 1.9200 level , upside pressure builds
  FxWirePro- Major Crypto levels and bias summary
  FxWirePro: USD/JPY edges higher as focus shifts to BOJ decision
  FxWirePro: USD/ CNY remains soft ahead of Fed decision
  FxWirePro: EUR/ AUD gains some ground , but remains on bearish path
  EURUSD Spikes to 1.14306 on Fed Pause as Traders Eye Sell-the-Rally Setup
  FxWirePro: EUR/AUD regains upwards momentum but unable to hold above 50%fib level
  FxWirePro: NZD/USD firms as Kiwi gains on strong ANZ business outlook data
  FxWirePro : GBP/NZD strongly bearish despite upside attempts
  FxWirePro:EUR/NZD gains some upside momentum but still bearish
  FxWirePro- Major Pair levels and bias summary
  FxWirePro: GBP/NZD maintains bersish bias with focus on 2.2900 level
  FxWirePro: USD/ZAR firms ahead of Fed interest rate decision
  NZD/JPY Flatlines Near 94.60: Will Key Support Reignite the Uptrend?


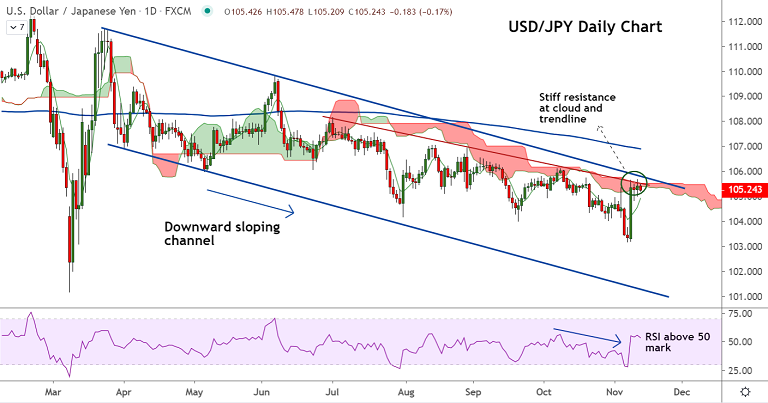
USD/JPY chart - Trading View
USD/JPY was extending sideways grind for the 3rd consecutive session as rising coronavirus cases across the U.S. dent market sentiment.
The major was trading 0.14% lower on the day at 105.28 at around 04:40 GMT, bias remains neutral.
Fundamental Analysis:
Moody’s Investors Services in a fresh credit review on Japan noted that Japan's debt burden is set to reach 230% of GDP in FY2020 due to coronavirus pandemic.
BOJ’s Adachi warns about the negative impact of the COVID-19 pandemic on the Japanese corporates while supporting the case for easy monetary policy.
Data Watch:
On the data front, Japan’s Producer Price Index (PPI) for October came in unchanged at -0.2% MoM and matched -2.1% forecasts on YoY.
Meanwhile, the September month Machinery Orders recovered to -11.5% YoY from -15.2% prior and slightly better than -11.6% expected.
Looking forward, focus will be on U.S. headline inflation for October and the weekly Jobless Claims which could provide some impetus.
Technical Analysis:
Major trend in the pair is bearish, but minor trend has turned bullish with shift in near-term moving averages.
Price action is consolidating above 55-EMA. RSI has edged above 50 mark. The pair is struggling at stiff resistance at 105.50 (converged cloud top and falling trendline).
Failure at cloud resistance and break below 55-EMA will see downside resumption. On the flipside, breakout above daily cloud will carry the pair higher.
Support levels - 105.25 (55-EMA), 104.92 (5-DMA), 104.74 (20-DMA)
Resistance levels - 105.52 (Cloud top), 105.85 (110-EMA), 106.90 (200-DMA)


