


 FxWirePro: AUD/USD uptrend loses steam, remains on bearish path
  FxWirePro: EUR/NZD firms after ECB holds rates steady at 2.25%
  FxWirePro :USD/JPY eases slightly, remains on bullish path
  Major Pairs Action Bias: USDCHF Emerges Extremely Bullish as EURUSD and GBPUSD Turn Deeply Bearish
  FxWirePro: GBP/USD downtrend loses steam but outlook still bearish
  FxWirePro: EUR/NZD downside pressure builds, key support level in focus
  FxWirePro: GBP/AUD bears maintain upper hand
  FxWirePro:USD/JPY hovers near a four-decade low
  FxWirePro- Major Crypto levels and bias summary
  FxWirePro: USD/CAD edges lower but bullish outlook persists
  FxWirePro: USD/CNY edges higher but bulls lack punch
  FxWirePro- Major Crypto levels and bias summary
  JPY Action Bias: USDJPY, EURJPY, and CADJPY Emerge as Top Extremely Bullish Picks
  FxWirePro: USD/CAD positions for another climb, eyes 1.4150 level
  FxWirePro: USD/CNY dips as yuan firms on improving risk appetite
  FxWirePro: EUR/AUD neutral in the near term, scope for downward resumption
  FxWirePro- Woodies pivot (Major)


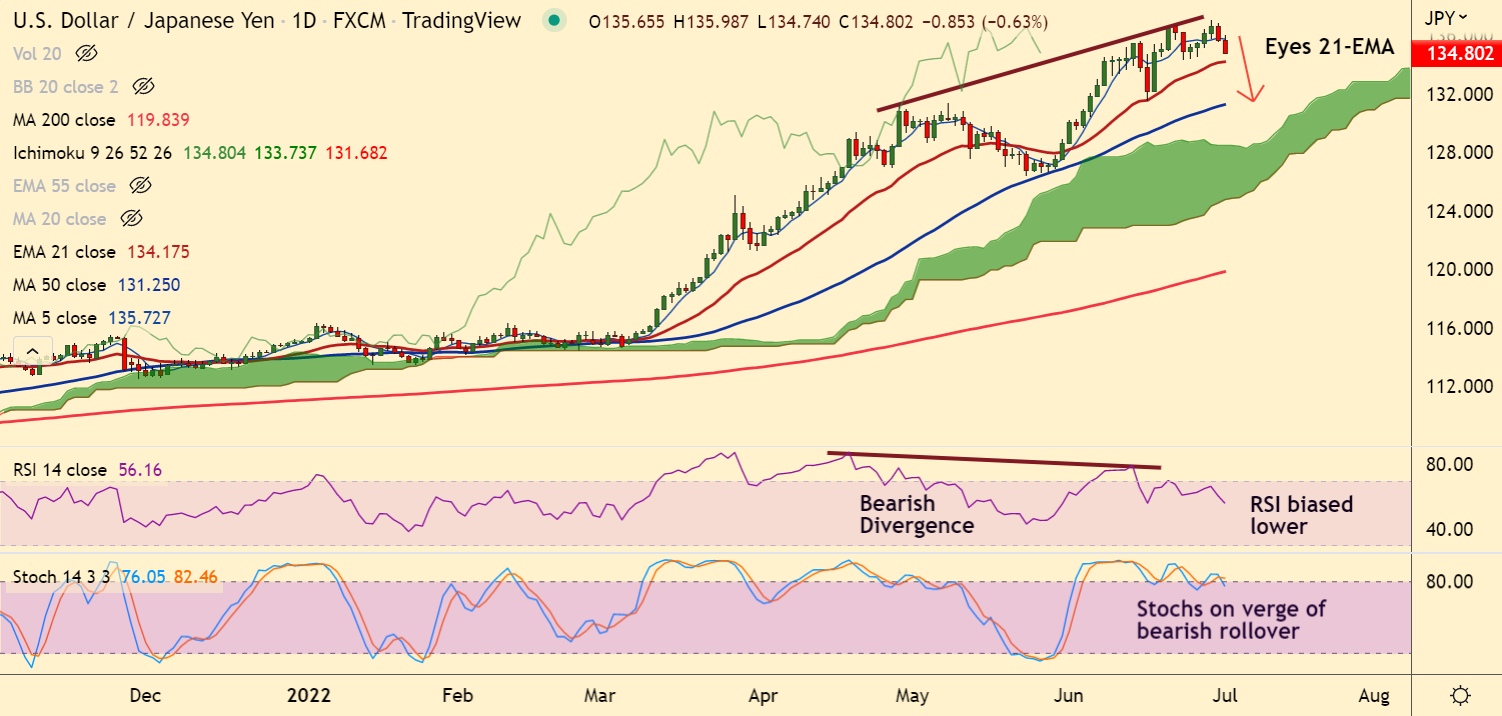
Chart - Courtesy Trading View
Spot Analysis:
USD/JPY was trading 0.63% lower on the day at 134.81 at around 06:10 GMT
Previous Week's High/ Low: 136.71/ 134.26
Previous Session's High/ Low: 136.81/ 135.54
Fundamental Overview:
Downbeat US personal spending and softer prints of the Fed’s preferred inflation gauge on Thursday, raised concerns over the economic health and drowned the US dollar.
US CORE Personal Consumption Expenditure (PCE) Price Index printed in line with the expectations of 4.7% but lower than the prior release of 4.9%.
On the other side, data released by the Statistics Bureau of Japan showed Japan jobless rate rose to 2.6%, higher than the estimates and the prior print of 2.5%.
Further, the Jobs/Applicants ratio has improved to 1.24, higher than the former print of 1.23 and remains in line with the consensus of 1.24.
Tokyo inflation rate has remained in a mid of estimates and the prior print of 2.2% and 2.4% respectively. A sustained inflation rate buoys well for the yen bulls.
Focus now on the US ISM PMI. Analysts expect the economic data may fall to 55 from the prior release of 56.1. Underperformance may weigh on the dollar.
Technical Analysis:
- USD/JPY is extending weakness below 5-DMA
- Bearish RSI divergence adds to the downside bias
- Price action has slipped below 200H MA and GMMA indicator has turned bearish on the intraday charts
- MACD confirms bearish crossover on signal line, Chikou span is biased lower
Major Support and Resistance Levels:
Support - 134.18 (21-EMA), Resistance - 135.75 (5-DMA)
Summary: USD/JPY trades with a bearish bias. The pair is on track to test 21-EMA at 134.18.


