


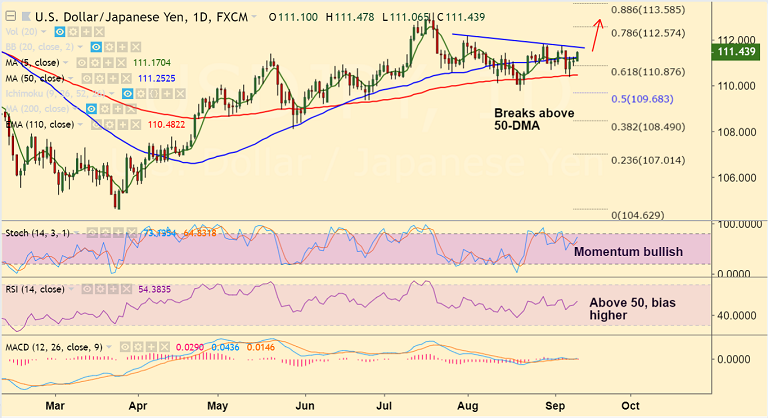
USD/JPY chart on Trading View used for analysis
- USD/JPY trades 0.29% higher on the day at 111.42, up from lows at 111.06.
- The Greenback remains bid on improved risk sentiment in the markets.
- Technical indicators have a neutral to slightly bullish bias on the daily charts.
- Price action has broken above 50-DMA and we see scope for test of major trendline resistance at 111.75.
- We see scope for further upside only on decisive break above. Test of 78.6% Fib at 112.57 then likely.
- On the flipside, break below 50-DMA could see retrace till 110-EMA at 110.48.
Support levels - 111.16 (5-DMA), 110.91 (55-EMA), 110.87 (61.8% Fib), 110.48 (110-EMA)
Resistance levels - 111.75 (trendline), 112.15 (Aug 1 high), 112.57 (78.6% Fib)
Recommendation: Good to go long on dips, SL: 110.90, TP: 111.75/ 112/ 112.15/ 112.55
FxWirePro Currency Strength Index: FxWirePro's Hourly USD Spot Index was at -32.9275 (Neutral), while Hourly JPY Spot Index was at 27.0931 (Neutral) at 0430 GMT. For more details on FxWirePro's Currency Strength Index, visit http://www.fxwirepro.com/currencyindex.


