


 EUR/JPY Holds Bullish Bias as Euro Extends Recovery
  Crypto Action Bias: ETHUSD Stands Out as the Bullish Pair to Watch
  JPY Action Bias: USDJPY Emerges as the Clear Bullish Pair to Watch Amid Mixed Crosses
  JPY Pairs Action Bias: EURJPY Leads as Bullish Standout Amid Mixed Momentum
  FxWirePro: NZD/USD neutral in the near-term, scope for downward resumption
  FxWirePro: AUD/USD dips after RBA Governor speech
  FxWirePro: USD/JPY eases ahead of Fed decision , Intervention risks linger
  FxWirePro: GBP/NZD maintains bersish bias with focus on 2.2900 level
  EUR/USD Bounces from Monthly Low, But Bearish Pressure Remains
  FxWirePro- Major Pair levels and bias summary
  FxWirePro: NZD/USD edges lower, remains on back foot
  FxWirePro: GBP/AUD gains some upside momentum but still bearish
  AUDJPY Weakness Deepens: Sell Rallies Toward 112 as Aussie Dollar Falters
  FxWirePro: GBP/AUD downside pressure builds, key support level in focus
  FxWirePro: EUR/AUD outlook weaker on renewed downside pressure


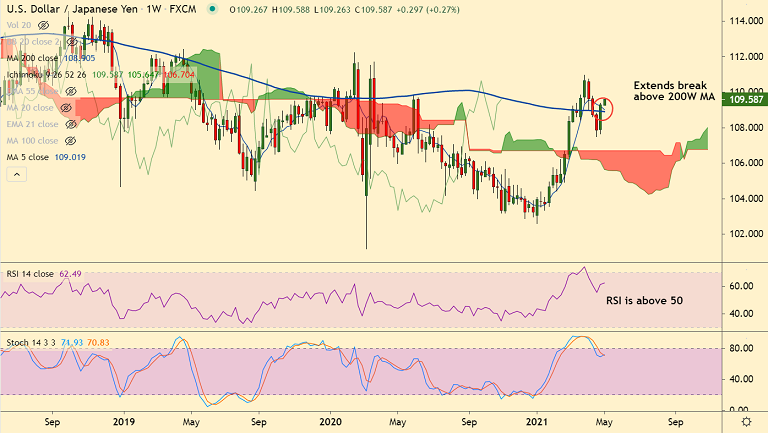
USD/JPY chart - Trading View
USD/JPY was trading 0.26% higher on the day at 109.57 at around 04:40 GMT, outlook is bullish.
The pair closed the previous week with an impressive 1.32% gains as month-end flows probably supported the pair.
Upside was seen despite mixed data from the U.S. and largely steady US Treasury yields.
US dollar continues with a positive momentum across the board and a weekly close above 200 week SMA reinforces upside bias.
On the data front, US ISM Manufacturing PMI for April will be in focus for an indicator for overall economic health.
The US manufacturing sector looks to continue its uptick as the US economy powers out of the pandemic.
The Purchasing Managers’s Index (PMI) from the Institute for Supply Management is forecast to rise to 65 in April from its 38-year high of 64.7 in March.
Major Support Levels:
S1: 109.01 (5-DMA)
S2: 108.90 (200W MA)
S3: 108.81 (21-EMA)
Major Resistance Levels:
R1: 110.07 (Upper BB)
R2: 110.67 (88.6% Fib)
R3: 110.96 (Yearly high)
Summary: Technical indicators have turned bullish. Any disappointment in U.S. data later today could drag the pair lower. Covid headlines could also impact price action. Scope for test of 88.6% Fib at 110.67.


